


Notice
Notice
International Real Estate Value Fund Q226


Dear Fellow Shareholders,
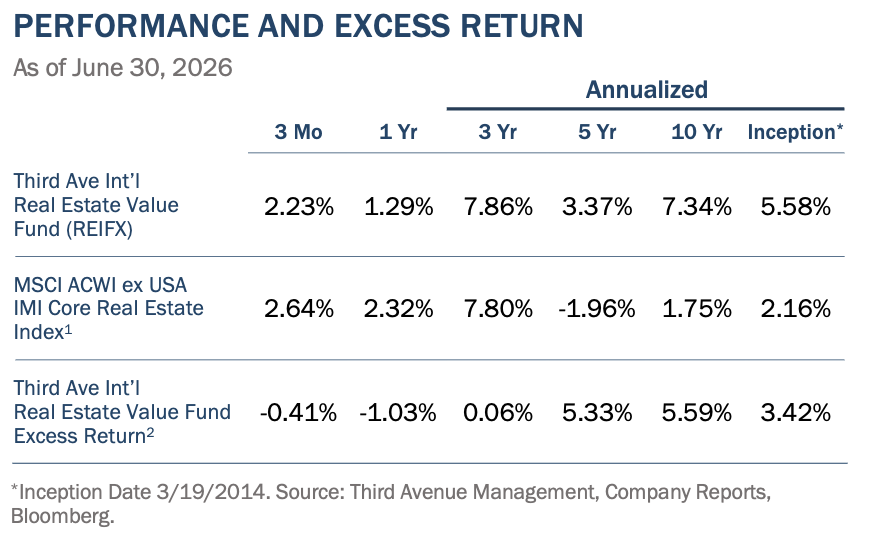
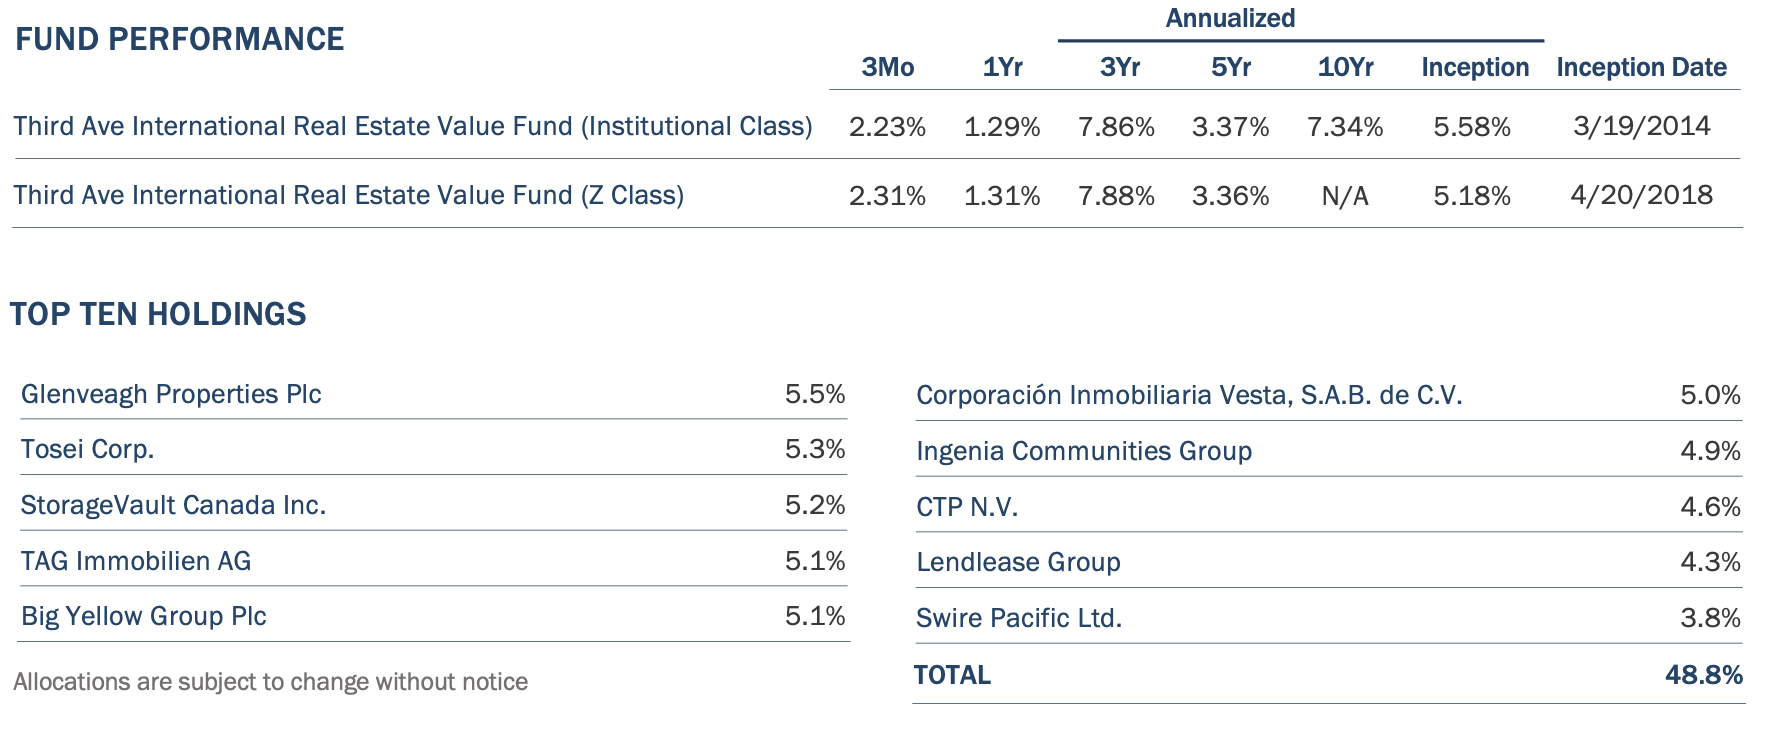
We are pleased to provide you with the Third Avenue International Real Estate Value Fund (the “Fund”) report for the quarter ended June 30, 2026. The Fund delivered a return of +2.23% (after fees) for the quarter, compared with the MSCI ACWI ex USA IMI Core Real Estate Index1 (the “Index”), which returned +2.64% over the same period. Fund Management believes long-term returns are more indicative of relative performance. Over the last 10 years, the Fund has outperformed the Index by 5.59% per year (after fees).
So far this year, dispersion across geographies and asset classes has increased amid ongoing tensions related to the Iran conflict. Fund Management capitalized on this dispersion by establishing two new positions, thereby enhancing the Fund's exposure to its top two structural themes: persistently undersupplied residential real estate and high-demand industrial real estate. Both investments were made at attractive discounts to intrinsic value. These discounts reflect a broader opportunity shaped by the current market environment. The Fund trades at about 10 times earnings, roughly half the valuation multiple of U.S. REITs, despite similar or better earnings growth. Fund Management believes this valuation gap is unprecedented and unsustainable, and the Fund is positioned to benefit as it closes.
ACTIVITY
A new investment in leading Spanish homebuilder Neinor Homes S.A. (“Neinor”) deepens the Fund’s exposure to a high conviction structural theme: residential real estate markets that are chronically and structurally undersupplied. In Europe, this theme already includes two existing Fund positions — Glenveagh Properties PLC (“Glenveagh”), an Irish homebuilder focused primarily on Dublin and its commuter belt, and TAG Immobilien AG (“TAG”), a German and Polish residential owner and developer with a large, stable German rental portfolio and a rapidly growing Polish platform.
Spain, Ireland, and Poland face a long-standing housing deficit that has been growing for over ten years and is now at a critical point. In each market, demand significantly exceeds supply, driven by common factors: (i) economies growing faster than the European average, (ii) structural deficits resulting from years of underbuilding that cannot be quickly fixed, (iii) favorable affordability ratios and low or decreasing mortgage rates, and (iv) government policies broadly supportive of new supply.
Following Neinor’s acquisition of AEDAS Homes last year, which was previously owned by the Fund, the company has become Spain’s largest homebuilder, mainly focused on major cities like Madrid. The combined entity plans to build 5,000–7,000 homes annually, supported by a land bank capable of sustaining production for over six years. The Fund’s investment thesis is based on several factors: (i) strong fundamentals in the Spanish housing market, where new construction is estimated to meet only half of annual new household formations despite rising house prices; (ii) attractive affordability, with the average Neinor homebuyer able to obtain a 30-year mortgage at rates in the low 2% range and home prices less than five times gross income; (iii) an acquisition price for AEDAS below intrinsic value, supported by conservative earnings guidance and multiple resource conversion options to enhance shareholder returns; and (iv) a shareholder return plan, with Neinor aiming for annual dividends exceeding 15% based on the current share price.
The Fund’s exposure to Poland is through its investment in TAG, a German-listed multifamily property operator. TAG owns over 83,000 rental units across Germany, generating consistent cash flow that has helped its expansion into Poland at a low cost of capital. Its Polish business—comprising ROBYG’s build-to-sell projects and Vantage Development’s growing rental portfolio—now makes up nearly half of TAG’s earnings, according to Fund Management. Despite this, Polish revenue remains undervalued at TAG Immo’s current share price. To prove this point, TAG launched an IPO for its Polish homebuilding unit ROBYG after the quarter ended, with shares pricing 25% above TAG’s book value for ROBYG. TAG still owns about two-thirds of ROBYG, with IPO proceeds used to further expand its Polish rental portfolio. This IPO validates some of the value hidden in many of the Fund’s investments. If the market valued TAG based on ROBYG’s current share price, TAG would need to trade approximately 20% higher to align with peer multiples.
Similar to targeted undersupplied residential markets, Fund Management views industrial real estate as one of the most compelling structural growth stories in global listed real estate. This is driven by two major demand factors that have been developing over the past 5-10 years. First, the continued rise of online retail and the need for proximity to urban centers for faster delivery. Second, nearshoring and ‘China plus one’ manufacturing strategies aimed at diversifying supply chains, especially in markets like Central and Eastern Europe, Mexico, and Southeast Asia. Recently, another demand driver has appeared, as the conflict in Iran has reinforced existing structural demand trends initiated by the Ukraine war—specifically, increased defense spending and focus on domestic energy independence. These are expected to be long-lasting trends, supported by political commitments that are expected to benefit Fund investments, particularly those located in Europe.
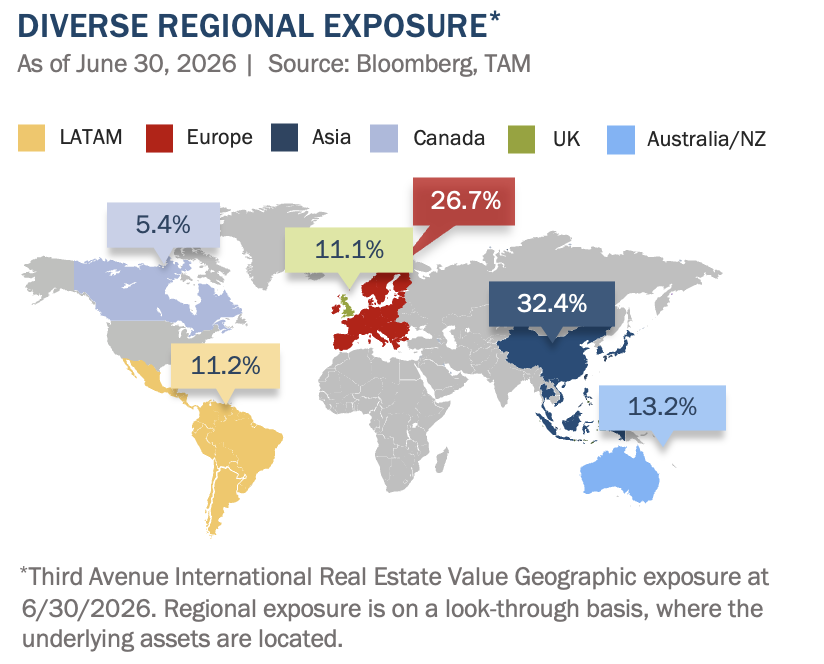
In light of these demand drivers, the Fund initiated an investment in Australia’s Dexus Industria REIT (“Dexus Industria”), adding a high-quality, e-commerce- and logistics-driven industrial platform to an existing industrial exposure that already includes nearshoring-oriented plays in Central and Eastern Europe (CTP NV and Warehouses De Pauw), Southeast Asia (Amata Corporation), and Mexico (Corp. Inmobiliaria Vesta S.A.B. de CV.), as well as logistics and e-commerce exposure in Brazil (LOG Commercial Properties).
Dexus Industria is an Australian industrial REIT with 88 high-quality warehouse and logistics assets, about 75% of which are located in urban ‘infill’ markets — Australia’s most sought-after industrial areas. The fully occupied portfolio recently recorded high single-digit net rental growth. It is managed by Dexus (ASX: DXS), a leading Australian real estate asset manager with roughly A$10 billion in industrial real estate assets. Our investment thesis is based on several factors: (i) an attractive valuation, including an 8% cap rate, a mid-teens AFFO multiple, a 7% dividend yield, and a 30% discount to NAV; (ii) the scarcity of infill industrial land in major urban centers, supporting premium occupancy and leasing spreads; (iii) a development pipeline of 12 projects offering attractive returns; (iv) a conservative, low-leverage balance sheet; (v) access to institutional deal flow, asset management, and operational expertise through Dexus; (vi) rental income growth outpacing construction cost inflation; and (vii) active share buybacks at a discount to NAV, highlighting shareholder alignment despite a less-than-perfect external management structure.
POSITIONING
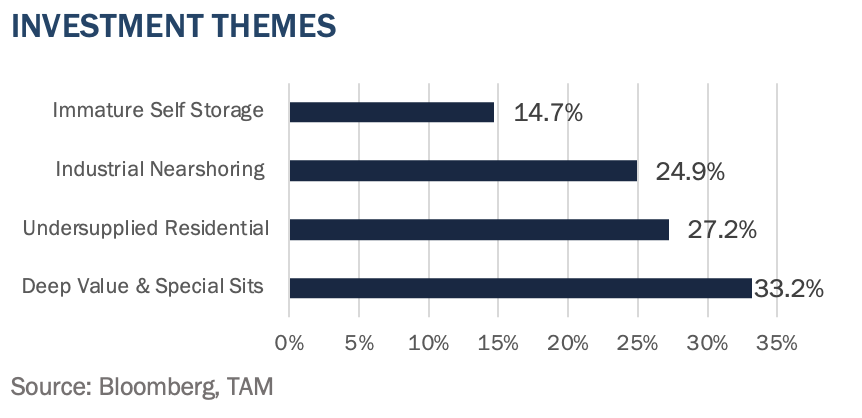
Including the above-referenced activity, the Fund's allocations remain broadly consistent with recent quarters. New investments in Neinor Homes and Dexus Industria modestly increase the Fund’s residential development and industrial/logistics exposures, respectively, reflecting the Fund’s elevated conviction in those two thematics.
OUTLOOK COMMENTARY – AN UNPRECEDENTED VALUE OPPORTUNITY
An underappreciated feature of the current market environment is the remarkable valuation divergence between international-listed real estate and its U.S. counterpart. International real estate delivered exceptional performance in calendar year 2025, with the Fund returning almost 27%. Yet this momentum has not carried into 2026. While U.S. REITs have rallied approximately 11% year-to-date on the back of domestic capital rotation, international listed real estate has largely traded sideways. The result is a growing valuation differential that is historically unprecedented in magnitude.
As illustrated in the accompanying chart, the Fund's price-to-earnings multiple has compressed to approximately 10 times, while U.S. REITs trade at about 20 times. This is not a story of slowing earnings, as the Fund's underlying holdings continue to grow earnings at attractive rates, driven by the structural and cyclical tailwinds inherent in underlying investments. Rather, it is a story of stagnant share prices amid compounding earnings. Mathematically, that should not persist indefinitely without either prices recovering or the fundamental investment case deteriorating. Fund Management is firmly of the view that the former is far more likely.
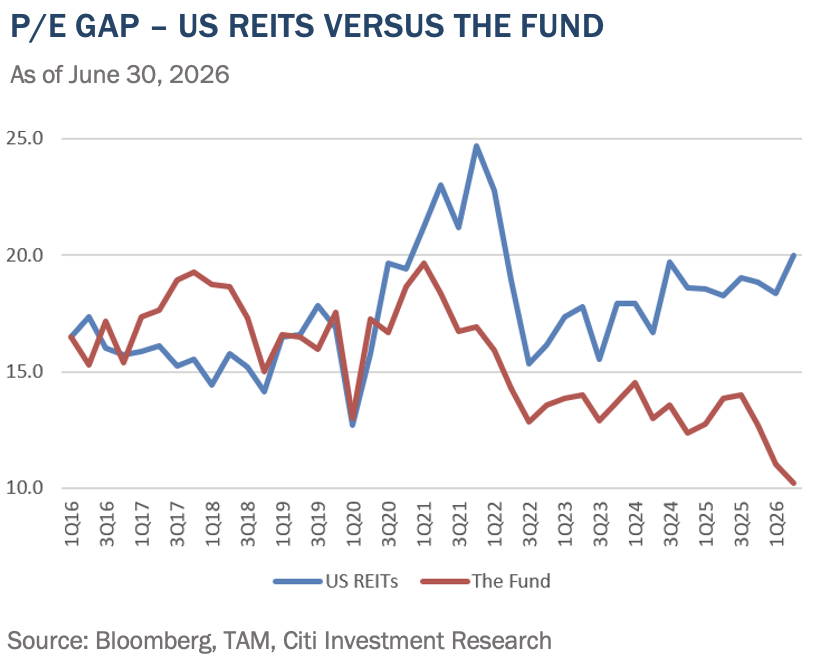
What makes the current discount particularly striking is the context in which it is occurring. For instance, U.S. REIT earnings growth for 2026 is broadly expected to be modest, with much of the re-rating driven by multiple expansion on domestic capital rotation. The Fund’s international real estate earnings, by contrast, are growing at what Fund Management estimates to be high-single-digit to low-double-digit rates across the Fund, similar to 2025 when the Fund’s investments achieved an average earnings growth of 12%. An investor buying the Fund today is acquiring earnings growth that is meaningfully faster at approximately half the valuation multiple. That is a risk-adjusted proposition rarely available in any asset class, let alone one backed by high-quality real assets.
Some U.S. REIT boards and management teams seem to agree — benefiting from relatively low-cost equity capital and elevated domestic valuations — are beginning to leverage this currency advantage to pursue international real estate acquisitions. The acquisition of Public Storage Canada by affiliated U.S. REIT Public Storage, and the approach by U.S. REIT Prologis to acquire UK-listed SEGRO, are early indicators of a trend that Fund Management expects could continue. Among the Fund's own holdings, self-storage owners such as Big Yellow in the U.K., and Shurgard in Europe appear well-positioned as potential targets, given what we believe to be their high-quality portfolios, conservative balance sheets, and the significant gap between their listed valuations and what institutional and strategic buyers have been willing to pay for comparable self-storage platforms in the private market.
The resolution of the current valuation anomaly, in Fund Management's view, is a question of when rather than if, and is likely to be driven by a combination of dynamics. This might include the above examples of public market M&A, as U.S. and other strategically positioned buyers use low-cost equity capital to acquire international platforms, seizing on the disconnect between listed and private market values, or market participants independently recognizing the valuation and earnings disconnect as the current cycle matures.
However, perhaps the most likely catalyst for the Fund is a broader rotation of capital toward real assets once the current concentration of market gains in artificial intelligence, memory, and semiconductor-related equities runs its course and ultimately reverses, as occurred following the technology, media, and telecom bubble in March 2000. In that earlier episode, the unwinding of an extraordinarily narrow, momentum-driven rally was followed by a multi-year period in which capital broadly rotated into real assets and value-oriented equities, including real estate, as investors re-priced risk and sought durable, tangible sources of cash flow. Fund Management does not attempt to predict the timing of such a rotation, but notes that the combination of historically elevated concentration risk in a small number of technology-related themes and historically wide valuation discounts in international real estate has, at a minimum, useful precedent.
In the interim, the Fund's underlying earnings yield of approximately 10%, combined with high-single-digit earnings growth, provides a compelling stand-alone return case that does not depend on valuation re-rating at all. As such, Fund Management is highly confident that the current pricing of international listed real estate, relative to both intrinsic value and U.S. peers, represents one of the most attractive entry points in the Fund's history.
We thank you for your continued support and look forward to writing to you again next quarter. In the interim, please do not hesitate to contact us with any questions, comments, or ideas at realestate@thirdave.com.
Sincerely, The Third Avenue Real Estate Value Team
Quentin Velleley, CFA Portfolio Manager

IMPORTANT INFORMATION
This publication does not constitute an offer or solicitation of any transaction in any securities. Any recommendation contained herein may not be suitable for all investors. Information contained in this publication has been obtained from sources we believe to be reliable, but cannot be guaranteed.
The information in this portfolio manager letter represents the opinions of the portfolio manager(s) and is not intended to be a forecast of future events, a guarantee of future results or investment advice. Views expressed are those of the portfolio manager(s) and may differ from those of other portfolio managers or of the firm as a whole. Also, please note that any discussion of the Fund’s holdings, the Fund’s performance, and the portfolio manager(s) views are as of June 30, 2026 (except as otherwise stated), and are subject to change without notice. Certain information contained in this letter constitutes “forward-looking statements,” which can be identified by the use of forward-looking terminology such as “may,” “will,” “should,” “expect,” “anticipate,” “project,” “estimate,” “intend,” “continue” or “believe,” or the negatives thereof (such as “may not,” “should not,” “are not expected to,” etc.) or other variations thereon or comparable terminology. Due to various risks and uncertainties, actual events or results or the actual performance of any fund may differ materially from those reflected or contemplated in any such forward-looking statement. Current performance results may be lower or higher than performance numbers quoted in certain letters to shareholders.
Date of first use of portfolio manager commentary: July 14, 2026
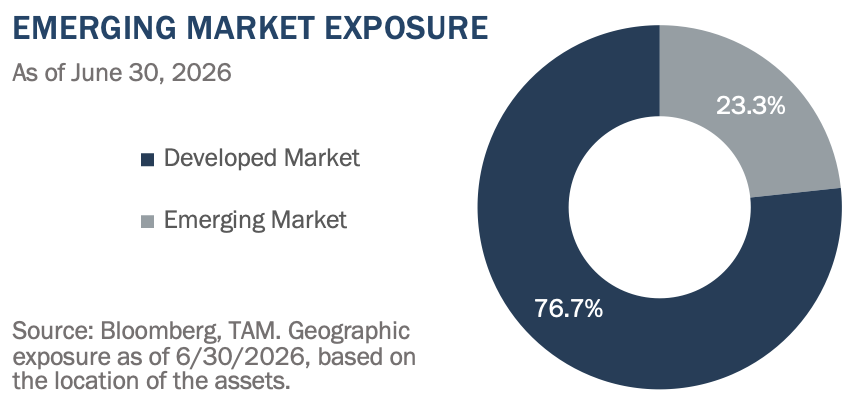
1 The MSCI ACWI ex USA IMI Core Real Estate Index is a free float-adjusted market capitalization index that consists of large, mid and small-cap stocks across 22 Developed Markets (DM) and 24 Emerging Markets (EM) countries engaged in the ownership, development and management of specific core property type real estate. The index excludes companies, such as real estate services and real estate financing companies, that do not own properties. Results for the index are inclusive of dividends and net of foreign withholding taxes.
2 Excess Return refers to the return from an investment above the benchmark. Source: Investopedia
Index Source: MSCI. MSCI makes no express or implied warranties or representations and shall have no liability whatsoever with respect to any MSCI data contained herein. The MSCI data may not be further redistributed or used as a basis for other indexes or any securities or financial products. This report is not approved, endorsed, reviewed or produced by MSCI. None of the MSCI data is intended to constitute investment advice or a recommendation to make (or refrain from making) any kind of investment decision and may not be relied on as such. An investor cannot invest directly in an index, and index performance does not reflect the deduction of fees and expenses.
For the Third Avenue Glossary please visit here.
Past performance is no guarantee of future results; returns include reinvestment of all distributions. The above represents past performance and current performance may be lower or higher than performance quoted above. Investment return and principal value fluctuate so that an investor’s shares, when redeemed, may be worth more or less than the original cost. For the most recent month-end performance, please visit the Fund’s website at www.thirdave.com. The gross expense ratio for the Fund’s Institutional and Z share classes is 1.52% and 1.46%, respectively, as of March 1, 2026.
Distributions and yields are subject to change and are not guaranteed.
FUND RISKS: In addition to general market conditions, the value of the Fund will be affected by the strength of the real estate markets. Factors that could affect the value of the Fund’s holdings include the following: overbuilding and increased competition, increases in property taxes and operating expenses, declines in the value of real estate, lack of availability of equity and debt financing to refinance maturing debt, vacancies due to economic conditions and tenant bankruptcies, losses due to costs resulting from environmental contamination and its related clean-up, changes in interest rates, changes in zoning laws, casualty or condemnation losses, variations in rental income, changes in neighborhood values, and functional obsolescence and appeal of properties to tenants. The Adviser’s use of its ESG framework could cause it to perform differently compared to funds that do not have such a policy. The criteria related to this ESG framework may result in the Fund’s forgoing opportunities to buy certain securities when it might otherwise be advantageous to do so, or selling securities for ESG reasons when it might be otherwise disadvantageous for it to do so. For a full disclosure of principal investment risks, please refer to the Fund’s Prospectus.
The fund's investment objectives, risks, charges, and expenses must be considered carefully before investing. The prospectus contains this and other important information about the investment company, and it may be obtained by calling 800-443-1021 or visiting www.thirdave.com. Read it carefully before investing.
Distributor of Third Avenue Funds: Foreside Fund Services, LLC.
Current performance results may be lower or higher than performance numbers quoted in certain letters to shareholders.
Third Avenue offers multiple investment solutions with unique exposures and return profiles. Our core strategies are currently available through '40Act mutual funds and customized accounts. If you would like further information, please contact a Relationship Manager at:

