


%402x.svg)
Notice
You are now leaving the Third Avenue Management website and being connected to a third-party website. Please note that Third Avenue Management is not responsible for the information, content or products(s) found on third-party websites.
Notice
Third Avenue Management is aware of recent incidents involving unauthorized individuals and groups falsely claiming to represent Third Avenue Management and its affiliates through social media platforms, messaging applications, email, and fraudulent websites. In some cases, these bad actors have used the names, photographs, or identities of Third Avenue employees in an attempt to appear legitimate.
These individuals and websites are not affiliated with, sponsored by, or endorsed by Third Avenue Management.
Third Avenue Management does not solicit investments, provide investment recommendations, or request personal or financial information through social media platforms or messaging applications such as WhatsApp, Telegram, Signal, or similar services.If you receive a suspicious communication claiming to be from Third Avenue Management, we encourage you to verify its authenticity before responding or providing any personal or financial information. If you are unsure whether you are communicating with an authorized representative of Third Avenue, please contact us directly using the contact information available on our official website.
Third Avenue Management, its affiliates, directors, officers, employees, and agents are not responsible for communications, representations, or activities conducted by unauthorized third parties. If you believe you have been the target of an impersonation or investment scam, or that you or someone you know has been a victim of fraud, please contact your local law enforcement agency and report the incident to the appropriate authorities. In the United States, suspected internet fraud can also be reported to the Federal Bureau of Investigation's Internet Crime Complaint Center (IC3) at https://www.ic3.gov/.
These individuals and websites are not affiliated with, sponsored by, or endorsed by Third Avenue Management.
Third Avenue Management does not solicit investments, provide investment recommendations, or request personal or financial information through social media platforms or messaging applications such as WhatsApp, Telegram, Signal, or similar services.If you receive a suspicious communication claiming to be from Third Avenue Management, we encourage you to verify its authenticity before responding or providing any personal or financial information. If you are unsure whether you are communicating with an authorized representative of Third Avenue, please contact us directly using the contact information available on our official website.
Third Avenue Management, its affiliates, directors, officers, employees, and agents are not responsible for communications, representations, or activities conducted by unauthorized third parties. If you believe you have been the target of an impersonation or investment scam, or that you or someone you know has been a victim of fraud, please contact your local law enforcement agency and report the incident to the appropriate authorities. In the United States, suspected internet fraud can also be reported to the Federal Bureau of Investigation's Internet Crime Complaint Center (IC3) at https://www.ic3.gov/.
Notice
You are now leaving the Third Avenue Management website and being connected to a third-party website. Please note that Third Avenue Management is not responsible for the information, content or products(s) found on third-party websites.
March 31, 2026
International Real Estate Value Fund
International Real Estate Value Fund Q126


Dear Fellow Shareholders,
We are pleased to provide you with the Third Avenue International Real Estate Value Fund (the “Fund”) report for the quarter ended March 31, 2026. The Fund delivered a return of -3.59% (after fees) for the quarter, outperforming the MSCI ACWI ex USA IMI Core Real Estate Index1, which returned -4.52% over the same period. The Fund’s outperformance was largely driven by its investments in Hong Kong-property companies.
Volatility stemming from the Iran conflict enabled the initiation of two new positions at deeply discounted prices, reflecting Fund Management’s focus on buying into well-financed entities with quality assets and management platforms when opportunities arise. Overall, current pricing significantly undervalues the Fund’s resilient cash flows. The forward price-to-earnings ratio below 12 times appears unreasonably low, given that these investments are projected to grow earnings by nearly 10% annually, in our estimation.
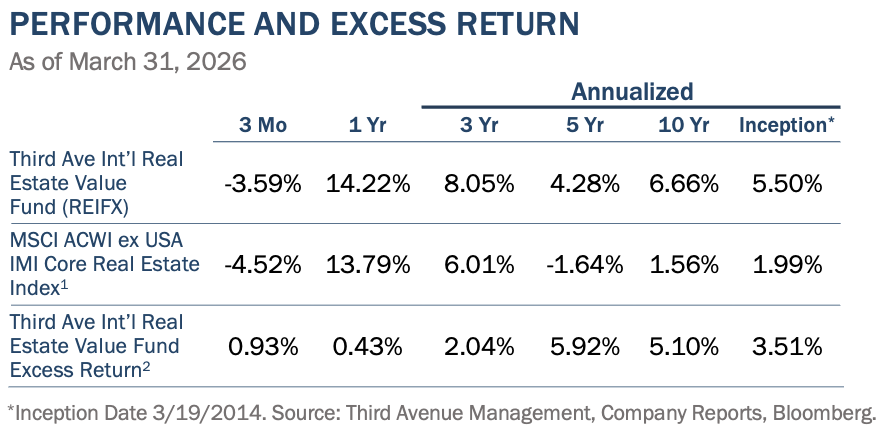
While the outcome of geopolitical events remains uncertain, the likelihood of elevated inflation has increased due to higher global energy prices. The Fund invests in hard assets that tend to retain value and generate high-margin, recurring cash flows. By focusing on rental revenues, which are tied directly or indirectly to inflation, the Fund seeks to protect returns against erosion of purchasing power. Additionally, the Fund’s underlying investments use conservative debt levels, which help maintain stability during periods of inflation and provide transaction optionality.
ACTIVITY
Proceeds from the successful privatizations of Mandarin Oriental and National Storage Australia REIT, mentioned in our last shareholder letter, were used to initiate two new investments. With discounted valuations and attractive potential entry points across the Fund’s investment universe, Fund Management often feels ‘spoilt for choice’ when seeking new ideas. As such, Fund Management has remained highly disciplined in choosing new investments, favoring high-quality real estate, premium real estate management platforms, aligned management teams, and conservatively financed companies with clear catalysts for earnings growth and share price appreciation.
In this regard, Fund Management took advantage of weak market sentiment and volatility to initiate a new investment in Hang Lung Group (“Hang Lung”). The primary rationale for this investment is Hang Lung’s strong position in the premium and luxury retail property sector, its well-established ‘66’ mall brand, and its strategic presence across Hong Kong and mainland China. The company’s early and ongoing expansion into mainland China demonstrates a long-term vision, resulting in 11 strategically located malls, including a significant new opening this quarter. Despite its high-quality portfolio, Hang Lung’s shares are deeply undervalued, trading at just 22% of book value and an 8 times earnings multiple—offering investors exposure to premium assets at compelling valuations. Fund Management identifies several potential share price catalysts, including a transition to higher returns following years of development and capital expenditure intensity that is now completing. This is combined with the acceleration of Chinese luxury retail activity, with Hang Lung’s China retail sales rising 18% in 4Q 2025 and momentum continuing. Furthermore, there are several avenues to realize value: simplifying and completing the legacy residential developments, pursuing a possible merger with Hang Lung Properties, and potentially divesting assets into a managed Chinese REIT.
Valuable management platforms at deeply discounted prices are not limited to Asia. This quarter, the Fund also initiated a position in London-listed Savills Plc (“Savills”) for its established credibility, global reach, and attractive valuation. As a leading real estate services company founded in 1855, Savills offers comprehensive services across commercial, residential, and specialized property through 700 offices worldwide. The franchise's reputation for quality, particularly in Asia and the U.K., underpins its ability to attract and retain clients, supporting its long-term growth prospects and justifying the Fund’s investment rationale.
A major recent development for Savills is its anticipated acquisition of the U.S. real estate services group Eastdil Secured, which significantly strengthens its U.S. platform and creates new opportunities for revenue growth and operational synergies. The transaction is expected to close in the coming months. Despite this strengthening of its business, Savills trades at approximately 5 times EBITDA, while U.S. peers trade above 10 times. The wide valuation gap highlights a clear opportunity for share price appreciation as Savills integrates Eastdil and delivers on its growth objectives. If the market does not recognize this value, management could pursue a primary U.S. listing, a move that has unlocked higher valuations for other U.K. companies. In summary, Savills offers investors a well-established global franchise with significant potential for both operational improvement and valuation re-rating.
POSITIONING
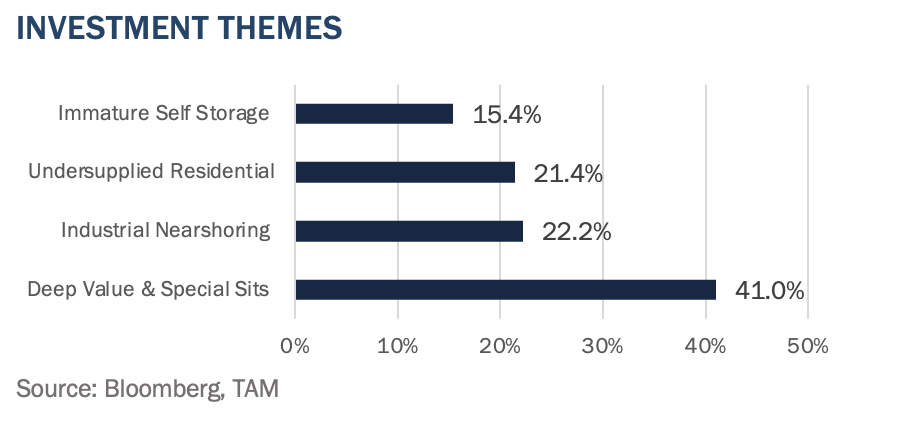
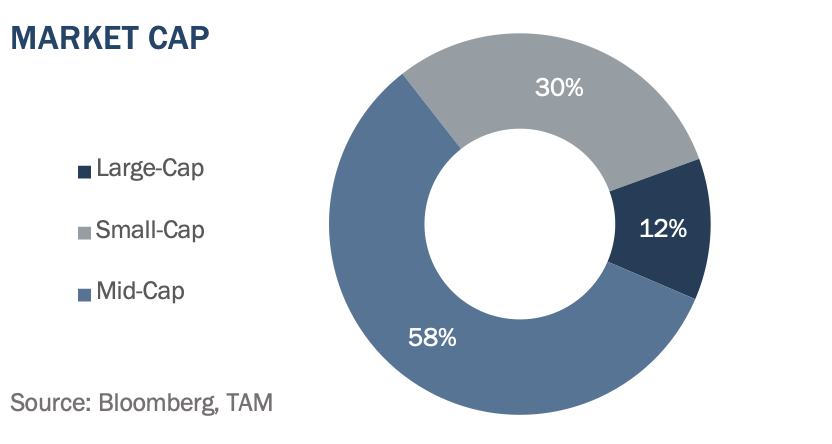
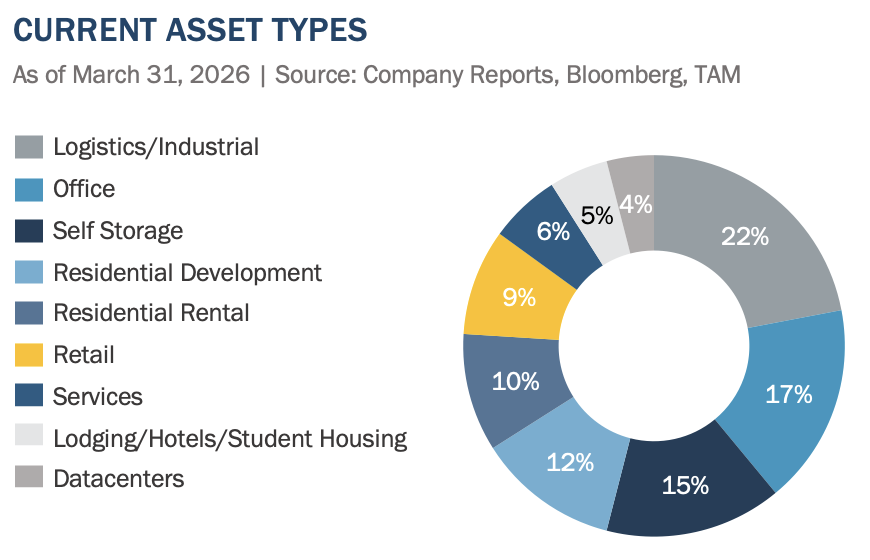
In addition to the above, allocations for the Third Avenue International Real Estate Value Fund remain consistent with recent quarters. The Fund emphasizes investments in (i) deep value and special situations, (ii) undersupplied residential markets, (iii) self-storage and logistics platforms with growth potential, as well as (iv) mid-cap firms with specialized or non-traditional assets and (v) diversified geographic exposure, as shown in the following charts.
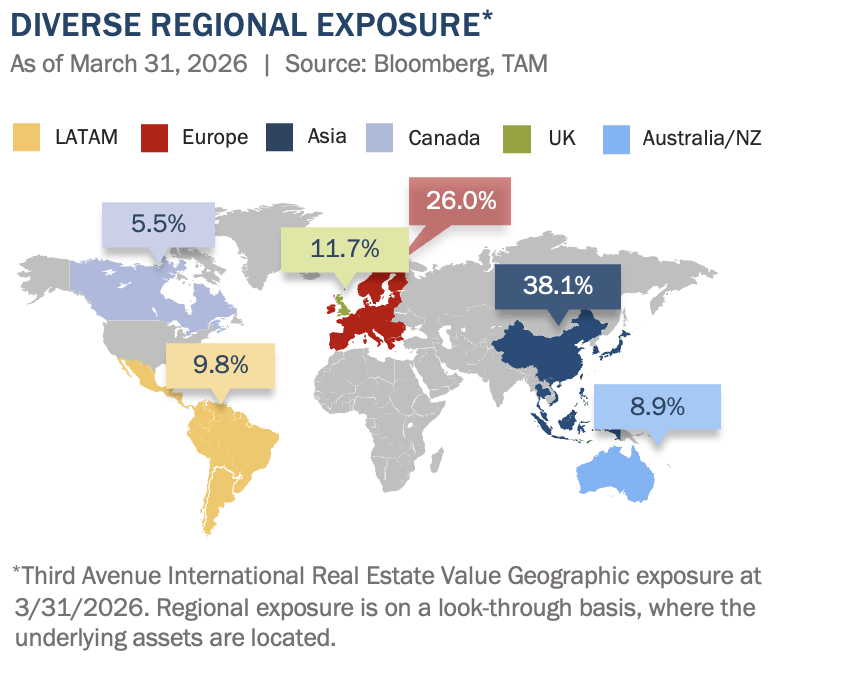
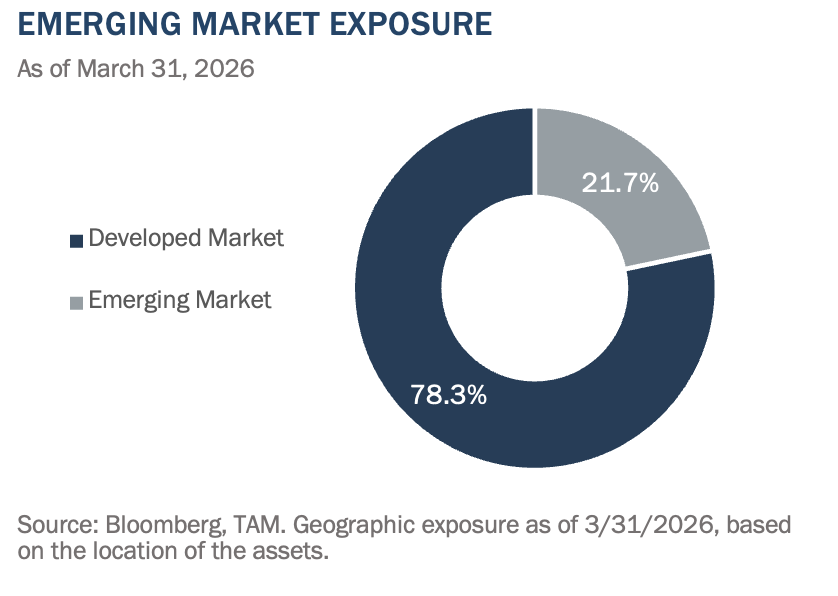
OUTLOOK COMMENTARY
While the long-term impact of the Iran conflict on inflation remains unclear, the Fund most recently faced higher inflation in 2022, driven by a combination of COVID-related monetary stimulus and a spike in European energy prices caused by the Russia-Ukraine conflict. At the time, European investments were negatively affected; however, active management helped the Fund's European portfolio outperform other European real estate constituents by 6% in 2022 and 9% in 2023. With the current Iran conflict in mind, the Fund has been structured to perform well during periods of elevated inflation risk and uncertain interest rates by focusing on:
- Low multiples and high yields - The Fund’s low 12x earnings multiples provide a wide margin of safety and strong positioning against inflation. Such low earnings multiples are associated with high real estate cap rates when implied by the share price. For example, the Fund’s self-storage investments, at the current share price, trade at implied real estate cap rates of 7.5%, compared with the U.S. average of 5.9%. That’s despite storage cash flows that should keep pace with, or even beat, inflation, and despite the Fund’s investments offering better growth prospects relative to the U.S., driven by lower occupancy, lower current rents, and more development opportunities. Similarly, the Fund’s industrial real estate investments have an implied cap rate of 7%, while U.S. industrial REITs trade at 5.6%. Similar disparities exist across the Fund’s residential, data center, and homebuilder segments.
- Inflation-linked and high cash conversion - Most rents in the Fund are inflation-linked or short-term, allowing quick adjustments to rising prices. For example, nearly all rents in Europe include inflation-indexation clauses, so revenues increase with the annual rate of inflation, while in Asia, most rents allow mark-to-market every few years. Consistent with the Fund’s underwriting process, investments target markets with limited supply and pricing power. Most rely on structural, long-term growth factors rather than short-term cyclical changes, such as the Fund’s focus on the global trend toward supply chain resilience and nearshoring in industrial real estate, immature self-storage, or residential real estate in undersupplied cities. Importantly, the underlying real estate assets require relatively low capital expenditures, and when combined with a preference for high operating margins, this results in a high conversion of revenue to free cash flow.
- Low debt levels —The Fund’s conservative balance sheets, with low debt levels and a mix of fixed- and floating-rate debt, help limit the impact of rising interest rates on cash flow. On average, the Fund’s debt as a proportion of assets, or ‘loan-to-value ratio3,’ is about 20%. In addition, Fund Management prefers highly flexible balance sheets with high cash balances, access to credit facilities, and multiple funding sources, so financial flexibility throughout the cycle can provide optionality for potential value-add transactions.
The combination of high implied yields (low multiples), inflation-linked revenues with high cash conversion, and low debt levels with financing flexibility positions the Fund well for an inflationary environment. Trading at what Fund Management views as the most attractive valuations in the Fund’s history (valuation as measured by a 12 times P/E ratio and a 37% discount to net asset value), we are constructive about the return potential. At the same time though, Fund Management remains alert to further volatility stemming from the Iran conflict, which could create dislocation and attractive investment opportunities. While the Fund's pipeline of prospective investments is as strong as it has been in several years, Fund Management intends to remain disciplined and opportunistic.
We sincerely appreciate your continued trust and support. Please reach out to realestate@thirdave.com with any questions, comments, or ideas. We look forward to keeping you informed and partnering with you for continued success in the coming quarter and beyond.
Sincerely, The Third Avenue Real Estate Value Team
Quentin Velleley, CFA Portfolio Manager

IMPORTANT INFORMATION
This publication does not constitute an offer or solicitation of any transaction in any securities. Any recommendation contained herein may not be suitable for all investors. Information contained in this publication has been obtained from sources we believe to be reliable, but cannot be guaranteed.
The information in this portfolio manager letter represents the opinions of the portfolio manager(s) and is not intended to be a forecast of future events, a guarantee of future results or investment advice. Views expressed are those of the portfolio manager(s) and may differ from those of other portfolio managers or of the firm as a whole. Also, please note that any discussion of the Fund’s holdings, the Fund’s performance, and the portfolio manager(s) views are as of March 31, 2026 (except as otherwise stated), and are subject to change without notice. Certain information contained in this letter constitutes “forward-looking statements,” which can be identified by the use of forward-looking terminology such as “may,” “will,” “should,” “expect,” “anticipate,” “project,” “estimate,” “intend,” “continue” or “believe,” or the negatives thereof (such as “may not,” “should not,” “are not expected to,” etc.) or other variations thereon or comparable terminology. Due to various risks and uncertainties, actual events or results or the actual performance of any fund may differ materially from those reflected or contemplated in any such forward-looking statement. Current performance results may be lower or higher than performance numbers quoted in certain letters to shareholders.
Date of first use of portfolio manager commentary: April 15, 2026
1 The MSCI ACWI ex USA IMI Core Real Estate Index is a free float-adjusted market capitalization index that consists of large, mid and small-cap stocks across 22 Developed Markets (DM) and 24 Emerging Markets (EM) countries engaged in the ownership, development and management of specific core property type real estate. The index excludes companies, such as real estate services and real estate financing companies, that do not own properties. Results for the index are inclusive of dividends and net of foreign withholding taxes.
2 Excess Return refers to the return from an investment above the benchmark. Source: Investopedia
3 Loan-to-Value Ratio refers to the ratio of net debt to gross asset value.
Index Source: MSCI. MSCI makes no express or implied warranties or representations and shall have no liability whatsoever with respect to any MSCI data contained herein. The MSCI data may not be further redistributed or used as a basis for other indexes or any securities or financial products. This report is not approved, endorsed, reviewed or produced by MSCI. None of the MSCI data is intended to constitute investment advice or a recommendation to make (or refrain from making) any kind of investment decision and may not be relied on as such. An investor cannot invest directly in an index, and index performance does not reflect the deduction of fees and expenses.
For the Third Avenue Glossary please visit here.
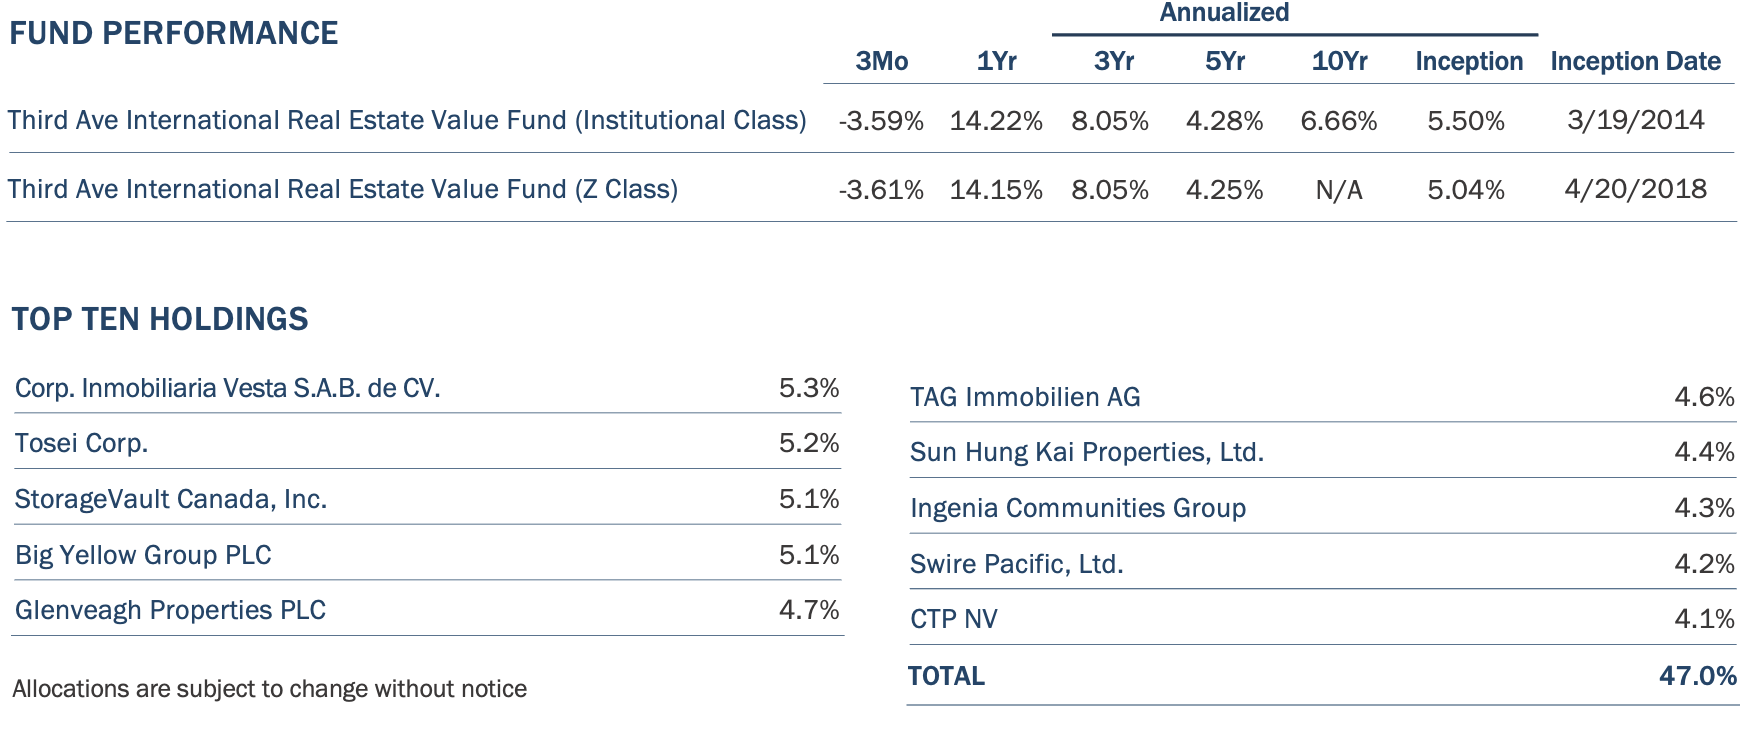
Past performance is no guarantee of future results; returns include reinvestment of all distributions. The above represents past performance and current performance may be lower or higher than performance quoted above. Investment return and principal value fluctuate so that an investor’s shares, when redeemed, may be worth more or less than the original cost. For the most recent month-end performance, please visit the Fund’s website at www.thirdave.com. The gross expense ratio for the Fund’s Institutional and Z share classes is 1.52% and 1.46%, respectively, as of March 1, 2026.
Distributions and yields are subject to change and are not guaranteed.
FUND RISKS: In addition to general market conditions, the value of the Fund will be affected by the strength of the real estate markets. Factors that could affect the value of the Fund’s holdings include the following: overbuilding and increased competition, increases in property taxes and operating expenses, declines in the value of real estate, lack of availability of equity and debt financing to refinance maturing debt, vacancies due to economic conditions and tenant bankruptcies, losses due to costs resulting from environmental contamination and its related clean-up, changes in interest rates, changes in zoning laws, casualty or condemnation losses, variations in rental income, changes in neighborhood values, and functional obsolescence and appeal of properties to tenants. The Adviser’s use of its ESG framework could cause it to perform differently compared to funds that do not have such a policy. The criteria related to this ESG framework may result in the Fund’s forgoing opportunities to buy certain securities when it might otherwise be advantageous to do so, or selling securities for ESG reasons when it might be otherwise disadvantageous for it to do so. For a full disclosure of principal investment risks, please refer to the Fund’s Prospectus.
The fund's investment objectives, risks, charges, and expenses must be considered carefully before investing. The prospectus contains this and other important information about the investment company, and it may be obtained by calling 800-443-1021 or visiting www.thirdave.com. Read it carefully before investing.
Distributor of Third Avenue Funds: Foreside Fund Services, LLC.
Current performance results may be lower or higher than performance numbers quoted in certain letters to shareholders.
Third Avenue offers multiple investment solutions with unique exposures and return profiles. Our core strategies are currently available through '40Act mutual funds and customized accounts. If you would like further information, please contact a Relationship Manager at:


Notice
You are now leaving the Third Avenue Management website and being connected to a third-party website. Please note that Third Avenue Management is not responsible for the information, content or products(s) found on third-party websites.