


Notice
You are now leaving the Third Avenue Management website and being connected to a third-party website. Please note that Third Avenue Management is not responsible for the information, content or products(s) found on third-party websites.
Notice
You are now leaving the Third Avenue Management website and being connected to a third-party website. Please note that Third Avenue Management is not responsible for the information, content or products(s) found on third-party websites.
June 30, 2025
International Real Estate Value Fund
International Real Estate Value Fund Q225


Dear Fellow Shareholders,
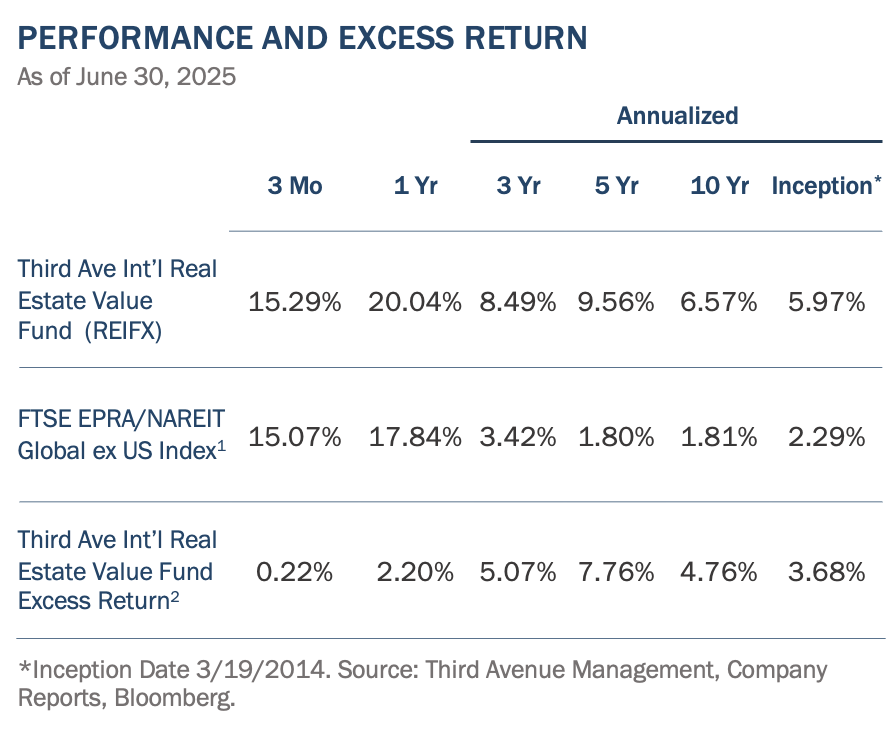
We are pleased to provide you with the Third Avenue International Real Estate Value Fund’s (the “Fund”) report for the quarter ended June 30, 2025. During the quarter, the Fund generated a return of +15.29% (after fees) compared to the most relevant benchmark, the FTSE/EPRA NAREIT Global ex-U.S. Index1 (the “Index”), which returned +15.07% (before fees) for the same period.
OBSERVATIONS
The Fund’s +22.18% return so far this year has been driven by several key factors, including: (i) underlying share price appreciation of about +14%, along with an +8% positive impact from the depreciation of the U.S. Dollar, (ii) substantial outperformance in the Fund’s ‘deep value’ Hong Kong-listed investments, which have returned +39% so far this year, ahead of the Hong Kong Property Stocks index at +21%, and (iii) solid performance from some of the Fund’s other ‘special situation’ investments like London-office REIT Helical (+47%) and Spanish-diversified REIT and data center-developer Merlin Properties (+24%).
ACTIVITY
Deep value investments are described in many circles as the type of value investing that focuses on companies with security prices that reflect excessive pessimism or neglect. These investments also usually involve companies trading at very low valuations, using metrics such as price-to-net asset value (“NAV”) and earnings multiples. At Third Avenue, such investments (i.e., those trading at more than a 30% discount to conservative estimates of NAV) comprise a substantial portion of the portfolios, but only if other factors are in place. Most importantly, these deep value holdings also require a combination of high-quality assets, limited amounts of debt, and an experienced management team, with prospects for resource conversion (or another catalyst) that would lead the market to recognize the discounted value over time.
While the Fund’s exposures to deep value investments can fluctuate, they currently represent about a third of the Fund’s assets across 11 diverse investments. These investments are trading at such steep discounts for various reasons, primarily: (i) a process of ‘resource conversion’ is underway, such as completing large data center projects (SuneVision – Hong Kong, Merlin Properties - Spain) or significant office developments (Mandarin Oriental – Hong Kong, Helical - London); (ii) resource conversion is combined with business simplification (Hongkong Land – Pan Asia, Swire Pacific – Hong Kong/China); and (iii) the market has not yet priced in a positive turnaround in cyclical low earnings (Genting - Singapore, Sun Hung Kai – Hong Kong). As each company progresses through the resource conversion process and cyclical earnings improve, there is tremendous upside potential for each of the Fund’s deep value investments.
During the quarter, the Fund increased its exposure to one of these deep value holdings by investing in Australian diversified developer and asset manager Lendlease Corp Ltd (‘Lendlease’).
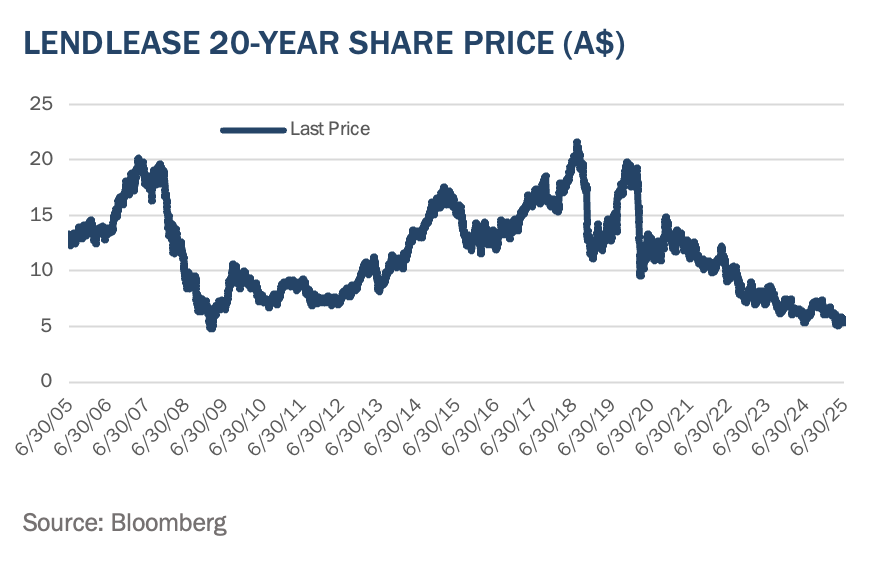
Founded in the late 1950s and listed on the Australian Stock Exchange in 1962, Lendlease established itself as a leading Australian real estate developer and construction company. However, Lendlease experienced mixed financial results when expanding into the U.S. in the 1970s and the U.K. in the 1990s. In retrospect, its growth came with costs, including various capital allocation mistakes, leading to share price fluctuations over the years. As a result, today, its shares are trading at levels similar to the lows during the Global Financial Crisis in early 2009, or about a quarter of its highs in 2018.
Fund Management has followed Lendlease closely for over 20 years and recalls attending a memorable Lendlease investor day in Sydney in 2004. Notably, the business model was strikingly complex. It involved nearly all types of real estate assets—from retail in Asia to military housing in the U.S.—and stretched the globe from the U.K. to Singapore, with revenue streams ranging from asset management to construction. Naturally, this complexity was amplified by multiple layers of senior management, including five divisional CEOs who presented that day. At the time, management proposed introducing even more complexity by internalizing the large Australian REIT (GPT) it managed. Although that attempt failed, Lendlease continued its intricate business model, expanding various long-term, mixed-use projects in the U.K.
Despite the complexity and bureaucracy, its strong Australian business has always maintained a competitive edge in developing highly profitable mixed-use projects supported by improved execution and risk management from its internal construction division. Impressive returns on capital from projects like Barangaroo in Sydney’s western central business district could boost shareholder returns, as shown in the 2018 share price chart above. Given the strength of the underlying Australian business, Fund Management was pleased that the board and leadership have embarked on a major simplification strategy. Announced in May 2024, the plan includes selling US$4 billion worth of assets, reducing the large overhead structure by US$80 million annually, and refocusing on its core role as a developer and manager of high-quality urban projects in Australia.
This simplified business is likely very valuable. Based on conservative assumptions, Fund Management estimates an A$10 net asset value per share, significantly higher than the current share price in the low A$5s. Fund Management believes Lendlease shares can trade closer to the estimated A$10 net asset value once more simplification is completed, and the earnings profile of the reemerged Australian business becomes clearer.
So far, Lendlease has completed over half of its simplification process, including selling construction divisions in the U.K. and U.S., Australian master-planned community projects, and joint ventures of its long-term, complex U.K. projects with British real estate group Grosvenor Estates. As part of the asset sales, Lendlease has proposed reducing balance sheet leverage and buying back up to 10% of its outstanding shares. This approximately US$300 million buyback is expected to begin soon, following the sale of additional non-core assets.
With deep value stocks like Lendlease, asset sales and buyback activities can be strong catalysts for attractive share price gains. The Fund experienced this first in 2023 when Swire Pacific announced a significant buyback after selling non-core assets, and again this year when Hongkong Land recently started an aggressive simplification process. We discussed that situation in our Q4 2024 letter. Notably during the quarter, Hongkong Land announced the sale of an office strata3 in their popular Central portfolio, with a quarter of the US$800 million sale proceeds being used for share buybacks. This buyback is being done at an undervalued price, which significantly boosts shareholder value, and in Hongkong Land’s case, has helped shares surge over 35% in 2025.
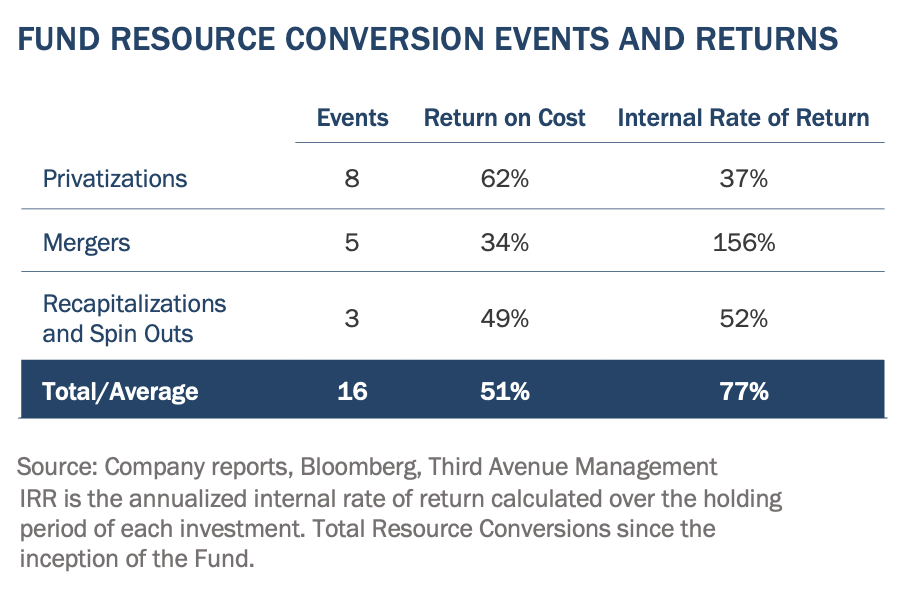
Pivoting to the topic of special situations, the Fund’s Q1 2025 investment in Japanese real estate company Aeon Mall Group (‘Aeon Mall’) benefited from the confirmation of Aeon Corp’s tender offer at a premium to the share price, enabling the Fund to achieve a relatively quick 17% return on investment. Despite Aeon Mall being acquired at a significant discount to the underlying real estate value, Fund Management was satisfied with the outcome due to the low risk and fast return on capital. This investment adds to the Fund’s successful track record in ‘resource conversion’ events, including mergers, privatizations, spin-offs, and recapitalizations. On average, these investments have generated annualized returns exceeding 40%, as shown in the following table, and have been a major contributor to the Fund’s excess returns.4
Transactions like Aeon Mall reveal inefficiencies that Fund Management sometimes encounters in public real estate markets during M&A activity outside the U.S. Another example is a recent privatization offer from ‘Ki’ (a joint venture with the controlling shareholder, U.S. self-storage REIT, Public Storage) to privatize Australian self-storage REIT Abacus Storage King (‘Abacus Storage’). Abacus Storage owns and manages a portfolio of 147 self-storage facilities across Australia and New Zealand, including many assets in urban Sydney and Melbourne that are hard to replicate. Ki’s offer was made at a 15% discount to the revised book value and at an even larger discount than what the portfolio and operating business would likely fetch in an arm's-length open market sale. The control group of the Fund’s investment in National Storage REIT Australia (‘National Storage’) appears to agree, having acquired over 9% of Abacus Storage since the Ki announcement. During the quarter, the Fund redirected proceeds from Aeon Mall to invest in Abacus Storage. Fund Management believes it is highly likely that Abacus Storage will either receive a revised bid from Ki near our estimated net asset value, or that National Storage will propose a more reasonable price to merge the portfolio while divesting some assets to appease competition authorities.
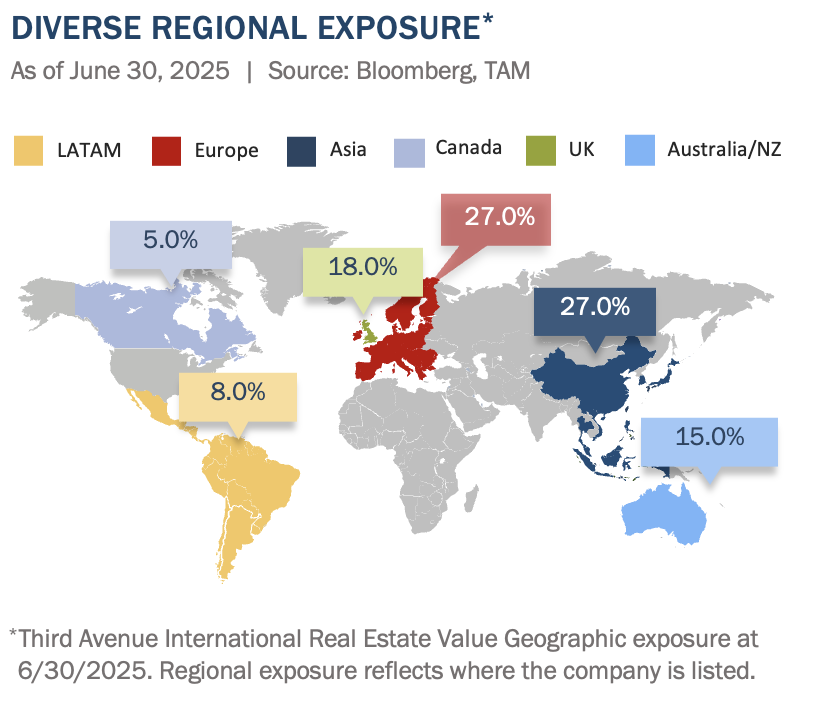
After incorporating this quarter’s activity, the Fund’s geographic exposures remain diverse, and as evidenced in the above chart, the Fund reduced exposure to Japan and increased exposure to Australia.
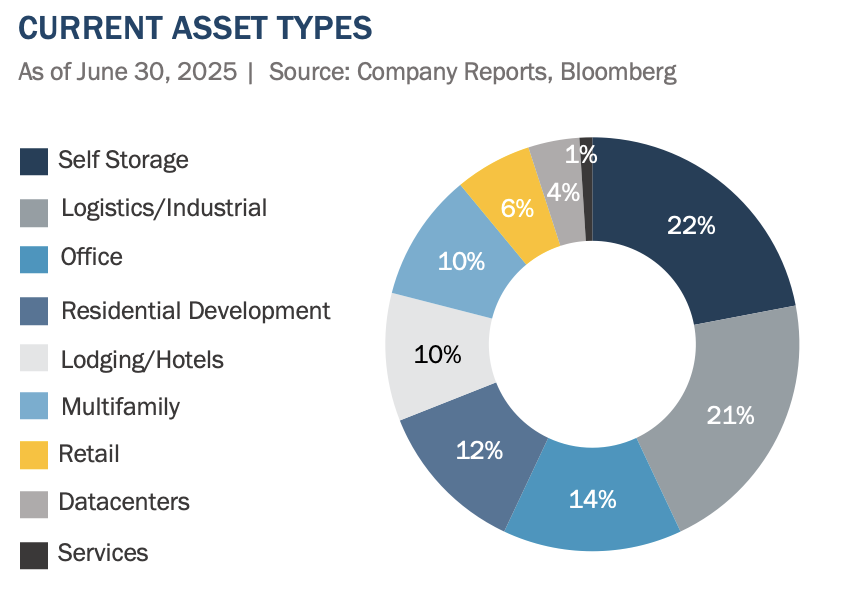
Regarding asset types, 64% of the Fund’s capital is invested in residential, industrial, logistics, and self-storage real estate assets. Additionally, exposure to traditional commercial real estate categories like retail and office makes up only 20% of the Fund, significantly less than a relevant index exposures near 50%. Also setting the Fund apart are the specialized real estate assets such as lodging, student housing, and data centers account for 16% of the portfolio.
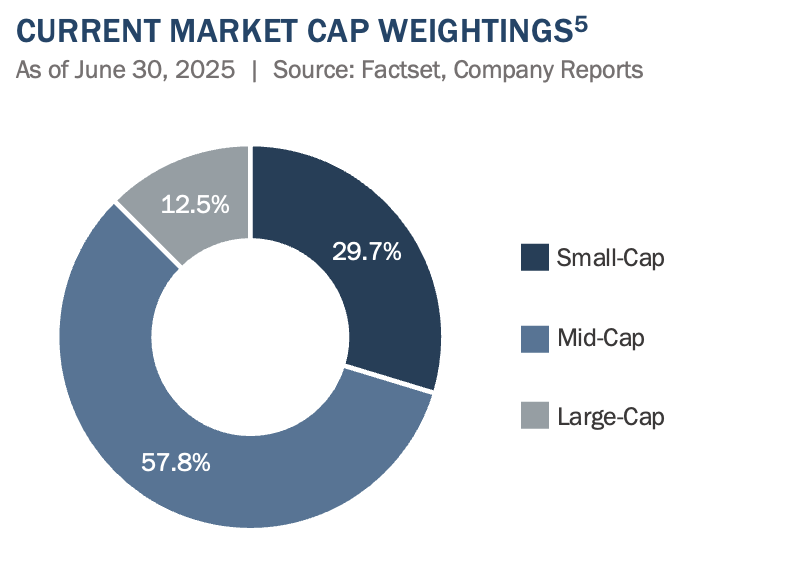
Given the Fund’s exposure to companies focused on individual property types in select geographic markets, its holdings tend to be more focused and often characterized as small- and mid-market-cap companies, as illustrated below.
FUND COMMENTARY
The current environment reminds Fund Management of the early 2000s when a combination of discounted valuations for international listed real estate (low P/Es and discounts to NAV), several years of technology sector outperformance, and a lack of new real estate supply led to an eventual regime change in equity markets. This shift caused international real estate to outperform global equities by about 10% annually for a decade.
However, no two time periods are the same. A notable example is the deterioration in the U.S.'s net international investment position (‘NIIP’) which measures the difference between U.S.-owned assets abroad and foreign-owned assets in the U.S. A negative NIIP indicates that the U.S. owes more to the rest of the world than it owns abroad. While the U.S. NIIP was only about 15% of U.S. GDP in 2000, it has grown to approximately 85% today.
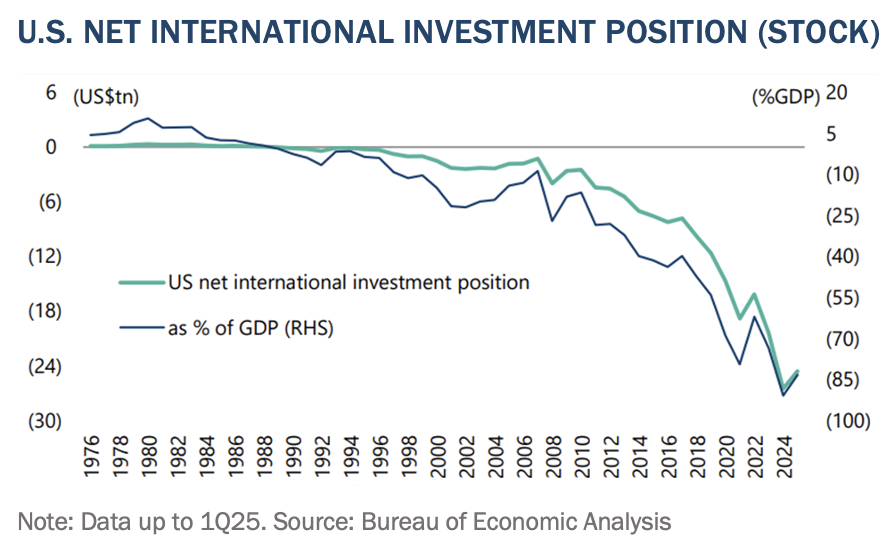
Today’s U.S. twin deficits (the fiscal and current account deficits) —have had a significant and lasting adverse effect on the U.S.’s NIIP. Consequently, the buildup of foreign claims on U.S. assets has made U.S. assets much more vulnerable to shifts in foreign investor sentiment and capital flows than they were decades earlier.
In this regard, Fund Management has observed increased nationalist investment tendencies among several foreign sovereign wealth funds, along with initial signs of regulatory changes that could favor more domestic (non-U.S.) investments. This was also evident with recently announced reforms to the U.K. pension system, where the U.K. government seems to be moving toward setting more binding asset allocation targets to encourage local investment.
This increasingly nationalist investment environment is also beginning to manifest itself in Hong Kong, where China’s State-Owned Enterprises (SOEs) are pouring large financial resources into Hong Kong’s capital markets, strengthening its role as China’s international financial center. While is is difficult to estimate, the southbound link, which allows Chinese investors to buy Hong Kong shares, has caused Mainland ownership to rise from about 5% of the Hong Kong stock market in 2020 to around 15% in 2025. Mainland investors now account for a significant portion of the trading volume. Although there has been no explicit policy or clear trend, some of China’s large current account surplus is likely finding its way into Hong Kong stocks. A rebound in the Hang Seng Index and mainland support for Hong Kong as a listing hub have created a substantial pipeline of potential stock market listings.
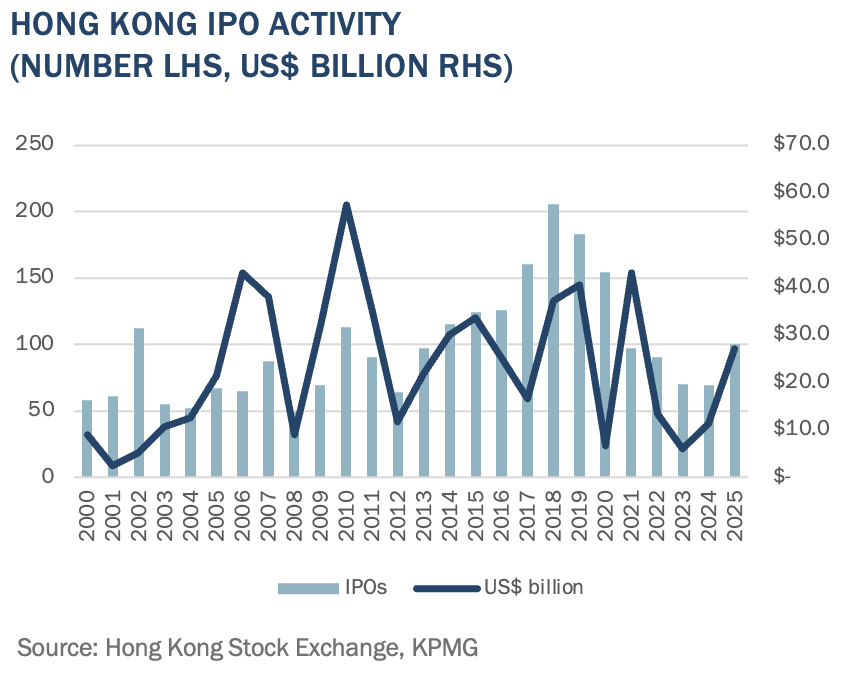
We observe that more than 200 initial public offerings are planned, mainly from new companies on the mainland or Chinese firms aiming for dual listings. Hong Kong’s position as a major Asian financial hub thus seems set to expand, supported by Hong Kong’s internationally aligned, common law-based legal system, with no capital controls, a simple, low-tax system, large and liquid capital markets, and a deep talent pool. Importantly, the mainland recently confirmed an indefinite continuation of the one country, two systems principle.6
Although economic conditions, including real estate fundamentals, have been weak in Hong Kong since the COVID pandemic, there are signs of improvement in underlying real estate fundamentals. This trend is expected to continue as the surge in capital market activity spreads throughout Hong Kong’s economy, creating a powerful multiplier effect across the city’s population of 7.5 million.
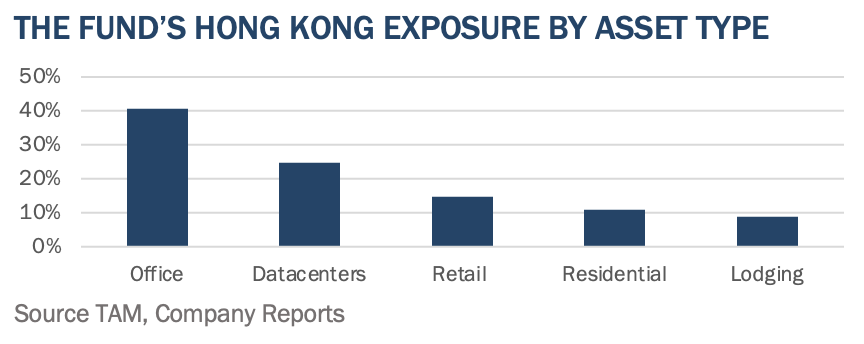
The Fund is positioned to benefit from Hong Kong’s increased capital market activity by investing in office, retail, and residential property, accounting for 9% of the Fund’s exposure and a 3% exposure to the leading datacenter company (SUNeVision). Despite impressive share price returns this year, the Fund’s Hong Kong exposure trades at very attractive levels, including an 12x P/E multiple and at just 54% of net asset value, not far from historic low valuation discounts.
With U.S. asset valuations seemingly more vulnerable to changes in foreign investor sentiment and capital flows, equity markets like Hong Kong can offer U.S.-based investors an uncorrelated return opportunity. This is supported by different capital flow dynamics, improving local fundamentals, and desirable valuation discounts. Many such instances exist across the Fund’s diverse geographic exposures.
With this in mind, Fund Management remains constructive on the outlook for the Fund. We thank you for your continued support and look forward to writing to you again next quarter. In the meantime, please don’t hesitate to contact us with any questions or comments at realestate@thirdave.com.
Sincerely, The Third Avenue Real Estate Value Team
Quentin Velleley, CFA Portfolio Manager

IMPORTANT INFORMATION
This publication does not constitute an offer or solicitation of any transaction in any securities. Any recommendation contained herein may not be suitable for all investors. Information contained in this publication has been obtained from sources we believe to be reliable, but cannot be guaranteed.
The information in this portfolio manager letter represents the opinions of the portfolio manager(s) and is not intended to be a forecast of future events, a guarantee of future results or investment advice. Views expressed are those of the portfolio manager(s) and may differ from those of other portfolio managers or of the firm as a whole. Also, please note that any discussion of the Fund’s holdings, the Fund’s performance, and the portfolio manager(s) views are as of June 30, 2025 (except as otherwise stated), and are subject to change without notice. Certain information contained in this letter constitutes “forward-looking statements,” which can be identified by the use of forward-looking terminology such as “may,” “will,” “should,” “expect,” “anticipate,” “project,” “estimate,” “intend,” “continue” or “believe,” or the negatives thereof (such as “may not,” “should not,” “are not expected to,” etc.) or other variations thereon or comparable terminology. Due to various risks and uncertainties, actual events or results or the actual performance of any fund may differ materially from those reflected or contemplated in any such forward-looking statement. Current performance results may be lower or higher than performance numbers quoted in certain letters to shareholders.
Date of first use of portfolio manager commentary: July 17, 2025
FUND RISKS: In addition to general market conditions, the value of the Fund will be affected by the strength of the real estate markets. Factors that could affect the value of the Fund’s holdings include the following: overbuilding and increased competition, increases in property taxes and operating expenses, declines in the value of real estate, lack of availability of equity and debt financing to refinance maturing debt, vacancies due to economic conditions and tenant bankruptcies, losses due to costs resulting from environmental contamination and its related clean-up, changes in interest rates, changes in zoning laws, casualty or condemnation losses, variations in rental income, changes in neighborhood values, and functional obsolescence and appeal of properties to tenants. The Adviser’s use of its ESG framework could cause it to perform differently compared to funds that do not have such a policy. The criteria related to this ESG framework may result in the Fund’s forgoing opportunities to buy certain securities when it might otherwise be advantageous to do so, or selling securities for ESG reasons when it might be otherwise disadvantageous for it to do so. For a full disclosure of principal investment risks, please refer to the Fund’s Prospectus.
1 FTSE EPRA/NAREIT Global ex US Index is designed to track the performance of listed real estate companies and Real Estate Investment Trusts in both developed and emerging markets. By making the index constituents free-float adjusted, liquidity, size and revenue screened, the series is suitable for use as the basis for investment products, such as derivatives and Exchange Traded Funds (ETFs). It is not possible to invest directly in an index.
2 Excess Return refers to the return from an investment above the benchmark. Source: Investopedia
3 Office strata refers to the ownership structure where different parties can own individual office floors, unlike a single owner controlling the entire building.
4 Calculated using internal rate of return
5 Small Cap is Equity Market Cap up to US$2bn, Mid Cap US$2bn-US$10bn, Large Cap >US$10bn.
6 The "one country, two systems" principle, as applied to Hong Kong, means that while Hong Kong is part of China, it retains its own capitalist economic system, legal system (based on common law), and way of life, distinct from mainland China's socialist system, for a period of 50 years (from 1997). This includes maintaining its own currency, customs territory, and a high degree of autonomy in most areas except for defense and foreign affairs. Recent commentary from Mainland officials suggests this system will be extended ‘indefinitely’.
For the Third Avenue Glossary please visit here.
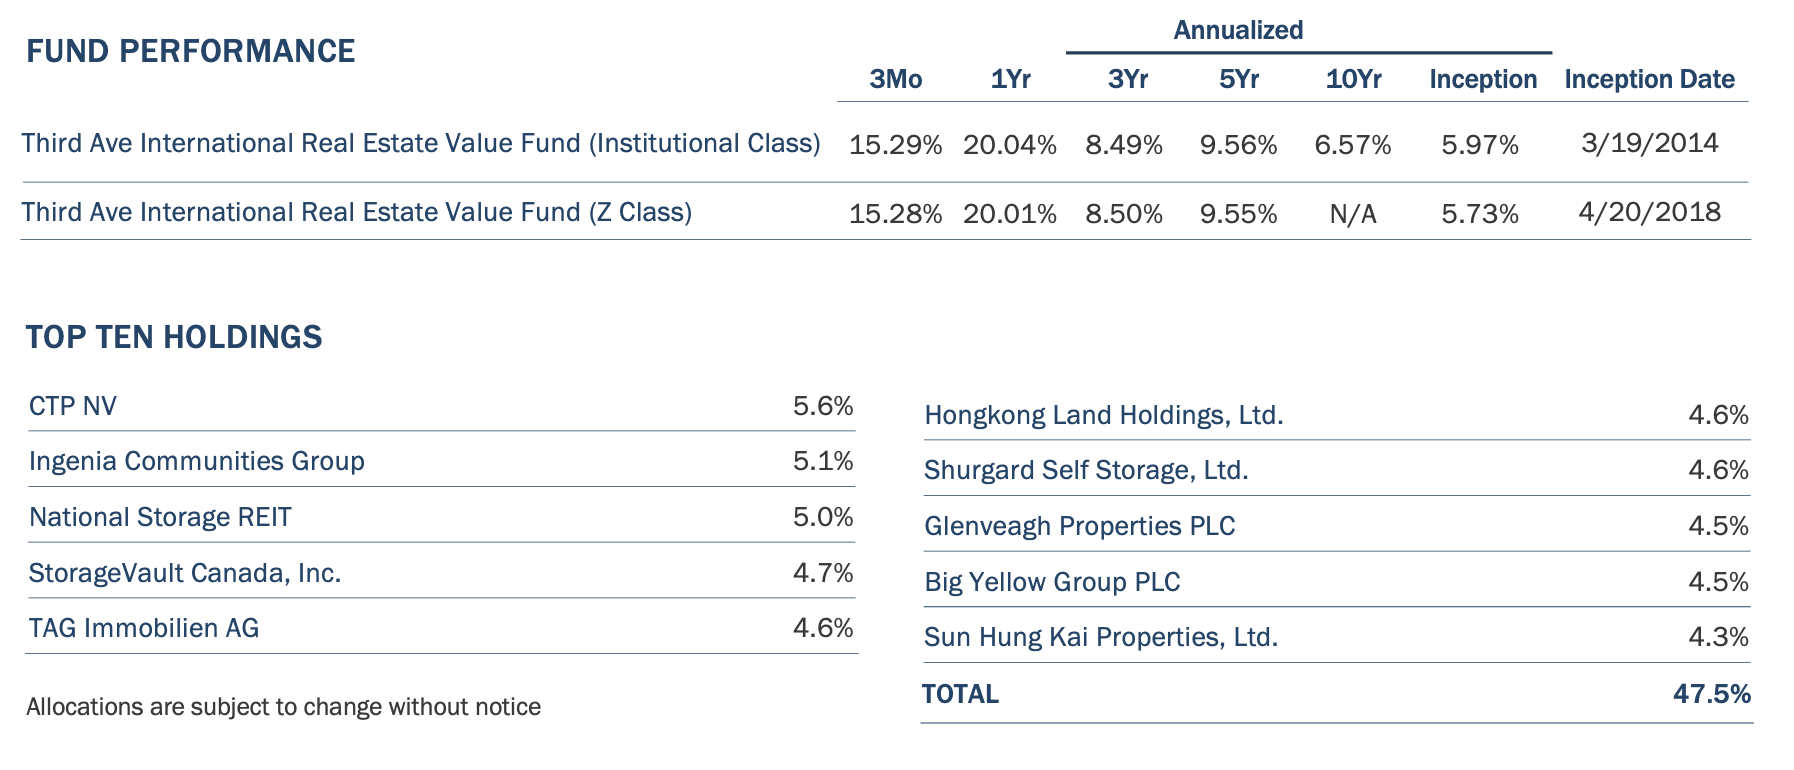
Past performance is no guarantee of future results; returns include reinvestment of all distributions. The chart represents past performance and current performance may be lower or higher than performance quoted above. Investment return and principal value fluctuate so that an investor’s shares, when redeemed, may be worth more or less than the original cost. For the most recent month-end performance, please visit the Fund’s website at www.thirdave.com. The gross expense ratio for the Fund’s Institutional and Z share classes is 1.54% and 1.48%, respectively, as of March 1, 2025.
Distributions and yields are subject to change and are not guaranteed.
The fund's investment objectives, risks, charges, and expenses must be considered carefully before investing. The prospectus contains this and other important information about the investment company, and it may be obtained by calling 800-443-1021 or visiting www.thirdave.com. Read it carefully before investing.
Distributor of Third Avenue Funds: Foreside Fund Services, LLC.
Third Avenue offers multiple investment solutions with unique exposures and return profiles. Our core strategies are currently available through '40Act mutual funds and customized accounts. If you would like further information, please contact a Relationship Manager at:

Notice
You are now leaving the Third Avenue Management website and being connected to a third-party website. Please note that Third Avenue Management is not responsible for the information, content or products(s) found on third-party websites.