


%402x.svg)
Notice
You are now leaving the Third Avenue Management website and being connected to a third-party website. Please note that Third Avenue Management is not responsible for the information, content or products(s) found on third-party websites.
Notice
Third Avenue Management is aware of recent incidents involving unauthorized individuals and groups falsely claiming to represent Third Avenue Management and its affiliates through social media platforms, messaging applications, email, and fraudulent websites. In some cases, these bad actors have used the names, photographs, or identities of Third Avenue employees in an attempt to appear legitimate.
These individuals and websites are not affiliated with, sponsored by, or endorsed by Third Avenue Management.
Third Avenue Management does not solicit investments, provide investment recommendations, or request personal or financial information through social media platforms or messaging applications such as WhatsApp, Telegram, Signal, or similar services.If you receive a suspicious communication claiming to be from Third Avenue Management, we encourage you to verify its authenticity before responding or providing any personal or financial information. If you are unsure whether you are communicating with an authorized representative of Third Avenue, please contact us directly using the contact information available on our official website.
Third Avenue Management, its affiliates, directors, officers, employees, and agents are not responsible for communications, representations, or activities conducted by unauthorized third parties. If you believe you have been the target of an impersonation or investment scam, or that you or someone you know has been a victim of fraud, please contact your local law enforcement agency and report the incident to the appropriate authorities. In the United States, suspected internet fraud can also be reported to the Federal Bureau of Investigation's Internet Crime Complaint Center (IC3) at https://www.ic3.gov/.
These individuals and websites are not affiliated with, sponsored by, or endorsed by Third Avenue Management.
Third Avenue Management does not solicit investments, provide investment recommendations, or request personal or financial information through social media platforms or messaging applications such as WhatsApp, Telegram, Signal, or similar services.If you receive a suspicious communication claiming to be from Third Avenue Management, we encourage you to verify its authenticity before responding or providing any personal or financial information. If you are unsure whether you are communicating with an authorized representative of Third Avenue, please contact us directly using the contact information available on our official website.
Third Avenue Management, its affiliates, directors, officers, employees, and agents are not responsible for communications, representations, or activities conducted by unauthorized third parties. If you believe you have been the target of an impersonation or investment scam, or that you or someone you know has been a victim of fraud, please contact your local law enforcement agency and report the incident to the appropriate authorities. In the United States, suspected internet fraud can also be reported to the Federal Bureau of Investigation's Internet Crime Complaint Center (IC3) at https://www.ic3.gov/.
Notice
You are now leaving the Third Avenue Management website and being connected to a third-party website. Please note that Third Avenue Management is not responsible for the information, content or products(s) found on third-party websites.
June 30, 2026
Small-Cap Value Fund
Small-Cap Value Fund Q226


Dear Fellow Shareholders,
The Third Avenue Small-Cap Value Fund (the “Fund”) returned 12.85% during the second quarter of 2026, as compared to a return of 12.61% for the MSCI USA Small Cap Value Index (the “Index”)1 and 17.19% for the Russell 2000 Value Index2. Year to date, the Third Avenue Small-Cap Value Fund returned 21.72%, as compared to a return of 15.91% for the MSCI USA Small Cap Value Index and 22.99% for the Russell 2000 Value Index. For the trailing three-year and five-year periods, the Fund has produced annualized returns of 17.76% and 12.37%, respectively, as compared to 16.27% and 8.81% for the MSCI USA Small Cap Value Index and 18.73% and 8.24% for the Russell 2000 Value Index.
During the second quarter, Fund performance benefited from diversified sources across a range of sectors and companies, such as infrastructure engineering company MYR Group, consumer debt collection business Encore Capital, regional bank UMB Financial, North American aluminum products manufacturer Kaiser Aluminum, and insurance business Octave Specialty Group. Companies detracting from Fund performance this quarter included offshore energy services company Tidewater, fertilizer producer LSB Industries, pharmaceuticals company Supernus, oil and gas producer SandRidge Energy, and government consulting company Maximus.
PERFORMANCE & PHILOSOPHY
In general, our team is pleased with Fund performance during the first six months of 2026, and we believe that Fund performance across various highly distinct operating environments within the first two quarters of 2026 highlights the strength of the Fund’s risk-adjusted returns in a couple of ways. First, while the Fund is managed with a relatively concentrated, high-conviction approach to portfolio management, maintaining a reasonable degree of diversification remains an objective. Second, the Fund’s positioning is conviction weighted and, within our approach, conviction is established not only by the extent of an investment’s undervaluation, but also by our team’s evaluation of the degree of downside protection offered by the quality of a company’s financial position, the quality and critical nature of its asset base, the quality of its management, risk of disintermediation and many other factors. The combination of undervaluation and downside protection relate directly to the concept of investment asymmetry and our goal of investing in opportunities that offer significant upside but limit the probability of a permanent loss of our capital.
For example, during the first quarter of 2026, the Fund produced a decidedly positive return of 7.85%, which compared to 2.93% for the MSCI USA Small Cap Value Index, resulting in a quarterly outperformance of 4.92%. It can easily get lost in the aggregate figures that the experience for U.S. small-cap equities was very positive for the first two months of the year but very negative during March. While the Fund did perform well during the first two months, and produced some relative outperformance, the majority of the Fund’s relative outperformance during quarter was gained during the month of March as the Fund’s return proved materially “less bad” than comparable indices. We attribute this experience to ownership of a portfolio of well-financed, non-speculative companies trading at modest prices brought together in a portfolio that is constructed with a reasonable amount of diversification. The concept of diversification applies not only to companies and industries but to the effort to limit aggregations of fundamental risk factors – such as interest rates, tariffs, energy prices, regulatory risk, etc. - that can accumulate within a portfolio as they weave through different sectors and business models.
More recently, during the second quarter, the Fund produced a very strong absolute return of 12.85% but trailed several common U.S. small-cap indices. We are completely at peace with this development. Amidst a considerable amount of broad U.S. small-cap equity strength, there were extreme divergences underneath the headline index performance figures. For example, during the quarter, the Russell 2000 Index, one of the most recognized U.S. small-cap indices, produced a return of 21.57%. Meanwhile, a small-cap index such as the S&P SmallCap 600 Index, which maintains explicit rules for inclusion mandating corporate profitability and financial viability, produced a return of 12.62% during the quarter, trailing the Russell 2000 Index, which has no such rules, by almost 9% in a single quarter. The Russell 2000 Index also outperformed Russell’s own U.S. small-cap quality index, the Russell 2000 Quality Factor Index, by a very wide 3.39% during the quarter. More pointedly, we have seen analysis calculating that unprofitable companies within the Russell 2000 Index outperformed profitable companies by 11.80% during the quarter.
Furthermore, index performance strength was particularly a result of areas of the U.S. equity market in which unusually high concentrations of exposure have accumulated within some U.S. small-cap indices. Technology weightings are, at present, very significant within many U.S. indices large and small. Meanwhile, the Semiconductors sector of the S&P SmallCap 600 Index returned 109.3% during the quarter, while the Electronic Components and Semiconductor Equipment sectors returned 108.12% and 83.13%, respectively. Investors with any type of long historical equity market perspective might sense it to be unusual for an entire sector of companies to be valued at more than double its value from one quarter ago (or more than 2.6x its value from two quarters ago) and for some excessive exuberance not to be present. Debating the validity of such momentum is beyond the scope of this letter. The point here is narrower; during the quarter, participation in the torrid momentum of the semiconductor industry and unprofitable and potentially highly speculative companies paid well. Relative underperformance in a period like this will certainly not keep us up at night. Meanwhile, the Fund’s performance has managed to keep pace with index performance during the first six months of the year. We speak a bit about transaction activity as one of the reasons for the Fund’s performance strength below.
WHERE ARE WE NOW?
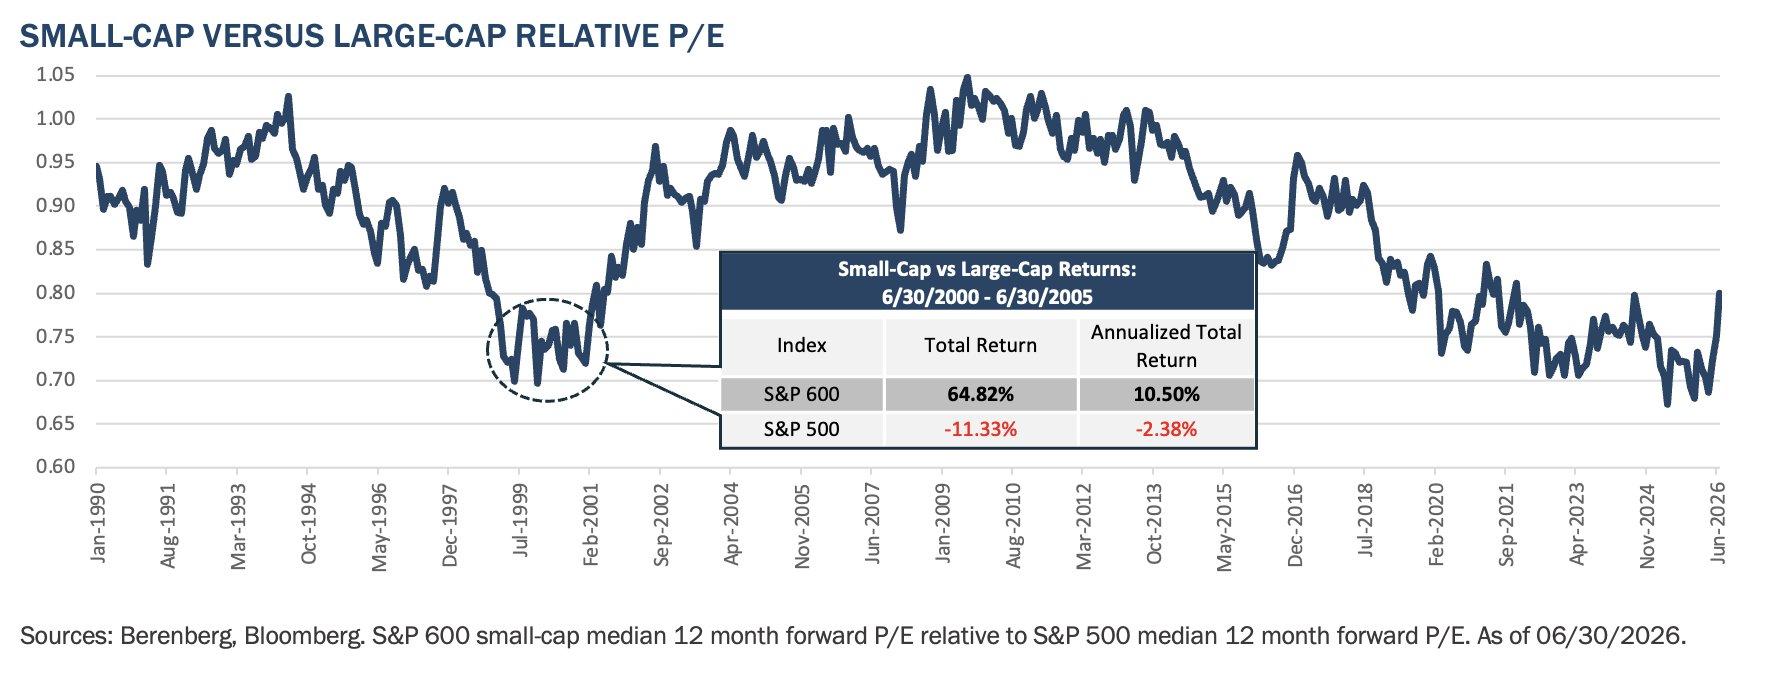
U.S. small-cap equities handily outperformed U.S. large-cap equities during the first six months of the year. For example, the S&P SmallCap 600 Index outperformed the S&P 500 Index by 13.79% during the first semester of 2026. This has been a remarkably rare occurrence in recent years but in some ways is quite a predicable development. Following roughly a decade-and-a-half of powerful U.S. large-cap outperformance, relative to U.S. small-cap stocks, small-cap valuations reached lows, relative to large-caps, only seen one other time in the last four decades. Some have assessed the duration of this bout of small-cap underperformance to be among the longest on record, contributing to the extraordinary degree of current valuation difference.
In summary, in our view, there is no way to argue that U.S. small-cap valuations hadn’t reached extremely unusual valuation levels relative to U.S. large-caps. Again, we are not here to argue against the validity of the valuation levels of stocks we don’t own, U.S. large-caps in this case. The point is that from relative small-cap valuation levels similar to the lows that were recently reached, the historical precedent was a powerful and enduring outperformance of small-caps relative to large-caps to the tune of almost 13% per year over a five-year period. Looking through that observational lens, recent outperformance should neither be surprising nor discouraging for future small-cap expectations. Relative valuations of U.S. small-caps remain very low and recent relative performance strength has only modestly shrunken that value spread. We perceive the opportunity to be very much still present.
RESOURCE CONVERSION UPDATE
While we perceive there to be a fantastic prospective opportunity for U.S. small-cap outperformance, we also perceive the U.S. small-cap arena to present special opportunities for selective fundamental investors. In a word, our approach is to buy significantly undervalued businesses that are facing some type of temporary headwind, real or perceived. We limit our investments to companies that are well-financed and where a strong balance sheet not only serves to weather a temporary headwind but also provides feedstock for value creation. Ideally, cheap and well-financed companies also house some very valuable assets and employ a talented and aligned management team. Not surprisingly at all, these traits also tend to attract acquirers of some of the businesses held within the Fund. This is particularly germane to the small-cap arena where fundamental undervaluation can get extreme and where business acquisition activity tends to be particularly robust, given the size of the companies, ease of acquisition financing and often lower regulatory hurdles. In fact, explicit analysis of the potential for a business to create value through resource conversion – such as disposing of separable assets, buying back shares at large discounts, or a sale of the entire company – is typically a material part of our fundamental analysis.
Furthermore, takeovers by strategic and financial buyers have been an important part of how the Fund has generated returns that compete well with small-cap indices, even in an environment in which broad index returns have been propelled by rampant momentum within the semiconductor industry and a fervor for unprofitable and speculative companies. Lately, U.S. merger and acquisition deal value has been robust and growing. According to Bain & Co’s Global M&A Report 2026, global M&A surged by 40% in 2025 with strategic acquisitions leading the way. Deal activity was particularly robust in the Americas, growing 52% year over year, led by strong growth in the United States. Meanwhile, the first half of 2026 has seen a continuation of similar M&A growth rates. Notably, merger and acquisition growth rates can have been seen across a wide range of industries.
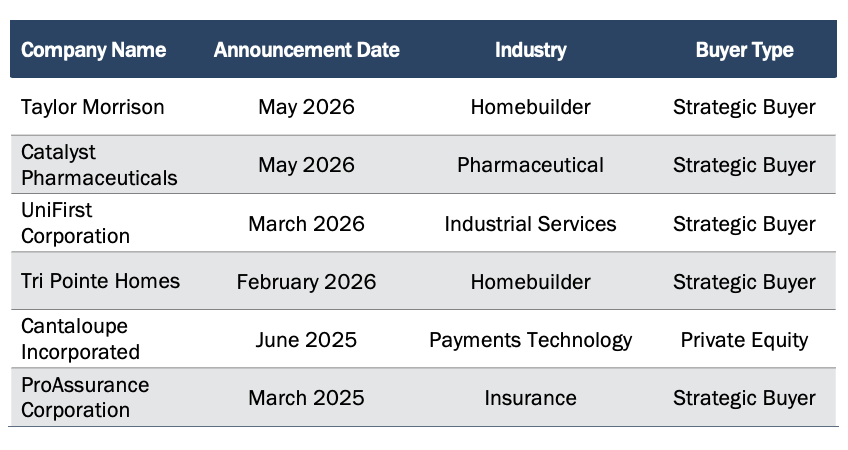
During the quarter, the performance of two Fund holdings benefited significantly from takeover offers. In May, Catalyst Pharmaceuticals agreed to be purchased by Italian pharmaceuticals company, Angelini Pharma, in an all-cash transaction. Later in May, Taylor Morrison Homes agreed to be purchased by Berkshire Hathaway in an all-cash transaction. While both were relatively recent purchases for the Fund, both positions made important contributions to Fund performance in the first six months of 2026.
Moreover, the Fund has benefited from a significant number of merger and acquisition transactions during the past two years. Six Fund holdings have agreed to be taken over during the last six quarters by a range of buyer types; domestic strategic, foreign strategic and private equity. Importantly, it has been the Fund’s general experience that the undervaluation we perceived prior to the takeover offers was acknowledged by the buyers in the form of healthy takeover premiums offered to shareholders.
Finally, as we view the current Fund portfolio through this lens of potential merger and acquisition activity, we can’t help but continue to feel optimism. It is also relevant that the current U.S. presidential administration, as well as its regulatory arms, appear as accommodative to merger and acquisition activity as we have seen in many years. To highlight a few possible areas for future transactions, the Fund holds several regional bank investments, an area of robust merger and takeover activity. Prosperity Bancshares, for example, holds an interesting strategic position in one of the country’s most attractive banking markets, Texas. The Fund has also recently established positions in deeply depressed building products distribution companies Boise Cascade and BlueLinx Holdings. Building products and building products distribution have long been consolidating industries, though the trend appears to be accelerating and, given strategically located nationwide networks of logistically well-connected distribution facilities, it would be easy to understand an acquirer’s attraction to either company. Supernus Pharmaceuticals could be a wonderful tuck-in for a host of blue-chip healthcare behemoths looking to offset lost revenue from looming patent cliffs with Supernus’ intellectual property, including promising neurology and central nervous system compounds.
ACTIVITY
Significant amounts of equity market volatility in recent quarters have had a positive impact on the Fund’s activity levels. During the quarter, the Fund initiated positions in three new holdings, Maximus Incorporated, Taylor Morrison Home Corporation, and CRA International. The Fund has initiated eight new positions year to date, which is an unusually high degree of activity facilitated by the presence of various areas of significant pessimism.
The Fund exited two positions during the quarter as the takeovers of Tri Pointe Homes and ProAssurance Corporation were completed, which is typically our preferred method of exit.
Maximus, Inc., headquartered in McLean Virgina, has over its fifty-year history grown to be one of the twenty largest government contractors, either public or private. This technology-forward consultant designs, owns and maintains the software stack for government entities, notably the IRS, the SEC’s EDGAR filings database and real-time referencing of the TSA’s “no fly” list, to name a few. Despite Maximus’ federal business revenue growing more than 8% in 2025, pessimism related the D.O.G.E. narratives have been unforgiving for Maximus’ share price, as well as the broader government consulting industry. Further clouding the perception around Maximus in 2026 has been the lapses in government funding and generalized fear of artificial intelligence disintermediation.
At the current valuation we believe there is an attractive opportunity to invest in a technology leader in its field, which provides considerable subject matter expertise and institutional knowledge in the design, implementation and administration of government programs. In addition to an absence of evidence of any operational impact related to the above-mentioned fears, management’s recent operational guidance and very substantial share buyback authorization both inspire confidence. Furthermore, Maximus’ management team also expressed confidence that operating margins will increase in 2026 due to its own internal use of artificial intelligence. One recent example is Maximus’ Veterans Affairs benefits administration business. Maximus receives a wide array of medical records from various benefits providers in myriad hard copy and digital file formats. Maximus has recently built a unique capability to harmonize unstructured data into uniform entries and now processes ten million pages of medical records every day in the Amazon cloud. Improving technological capabilities allows Maximus to process faster and more accurately, resulting in significantly reduced headcount and cost.
Going forward, we believe the pessimism overhanging Maximus can be alleviated by the renewal of its Veterans Affairs benefits contract, which relies on a difficult to replicate nationwide network of medical providers. Additionally, the company was recently awarded a large new contract with the U.S. Air Force for cyber security consulting work, an impressive validation by one of the most sophisticated clients in the world and a potential beachhead from which to expand their expertise into larger active military benefits programs. Several looming developments could also provide a tailwind for Maximus in the medium-term, such as the implementation of the One Big Beautiful Bill Act which includes changes to Medicaid work requirements, SNAP (food stamp) benefits and the processing of unemployment claims. The changes around proof of employment, along with multiple redetermination checkpoints, may offer Maximus an opportunity to expand its scope of work under existing service contracts. In short, Maximus appears to have credible in-house artificial intelligence capabilities and a degree of embedded business resilience that belies its beaten down share price. Further, the attractive attributes of its business, in combination with large amounts of pessimism embedded in its valuation, may eventually lead to a potential business combination with any number of strategic partners, such as a larger consultant, cloud companies, or possibly a defense contractor.
Taylor Morrison Home Corporation is the fifth largest U.S. homebuilder and land developer. With operations spanning twelve states, the company is well respected for the quality of its product and its management team. The core Taylor Morrison brand serves entry-level and move-up buyers, while the company’s Yardly segment operates as a build-to-rent platform in nine markets. The company also caters to the premium resort-lifestyle and active-adult segment through its Esplanade offering.
Prior to its recent strong appreciation, Taylor Morrison’s valuation seemed incommensurate with its underlying business value. The company also bore some similarities to former Fund holding Tri Pointe Homes regarding the strength of its asset quality, including a strategically located land bank with an attractive cost basis and a strong position in attractive customer segments. Taylor Morrison is also extremely well-financed and the company has been an aggressive buyer of its own stock at attractive prices. The combination of opportunistic buybacks, consistent profitability and reduced capital intensity, due to a shift to a more asset light operating model, has led to the compounding of book value per share at impressive rates.
Yet, shortly after our purchase, the company announced that it had reached an agreement to be purchased by Berkshire Hathaway. Berkshire, presumably appreciating the strategic merits and discounted valuation we described above, offered a premium of slightly more than 25% to acquire the company, adding to its existing homebuilding operations. While we intended to own Taylor Morrison for years into the future, and we perceive Berkshire to be acquiring the company at an attractive valuation, we have had a brief but successful investment, and we wish Berkshire and Taylor Morrison’s management team future success together.
CRA International, Inc., which operates under the brand Charles River Associates, is a global consulting firm specializing in economic, financial, and management consulting. Founded in 1965 and headquartered in Boston, many of CRA’s senior staff are globally recognized experts in their fields, which focus on large-scale merger and acquisition consulting, anti-trust actions, major regulatory and litigation matters and complex strategic issues. CRA is a “go-to” industry leader in the legal consulting arena and has worked on engagements with 98 of the top 100 global law firms over the past two years.
Despite strong demand for antitrust services and increased scrutiny of certain industries, contemplation of the potential future impacts of artificial intelligence have significantly impacted the company’s share price. This backdrop has provided the Fund an opportunity to initiate a position after years of following the company from the sidelines. Highly credible consulting services, which represent minimal expenses within the context of multi-billion mergers, seem an ill-advised area in which to pursue nominal cost savings in exchange for incurring significant legal and deal-completion risk. CRA’s established credibility, in tandem with constantly evolving expert analysis, often helps shape how courts define market competition and quantify potential merger impacts to consumers. This has emerged as a more pivotal part of the merger and acquisition processes than ever and appears poised to resist displacement from artificial intelligence while also supporting deal-related demand growth as developing technologies produce evolving market definitions and increased global scrutiny.
Going forward, we believe the sentiment overhang, as well as an accounting treatment for certain forms of employee compensation that periodically depresses the reported earnings of the business without an impact upon the genuine underlying cash economics of the business, have created an attractive entry point for long-term shareholders. We believe the company is prudently investing in expanding its business and preparing for the future. In the meantime, today CRA maintains a strong balance sheet and has historically compounded the value of its business at attractive rates over long periods of time. CRA’s management team appears to be well aligned with shareholders who benefit from having the continuity of a seventeen-year veteran CEO at the helm who also owns a sizeable ownership stake. The company appears to manage its capital sensibly and has a historical track record of shrinking its share count by an annual rate of approximately 3% per year over the past decade. Should a further pickup in M&A volume occur, we believe the operating leverage of the business can be put on full display and meaningfully reward shareholders.
CONCLUSION
U.S. small-caps have seen strong performance year-to-date and may continue to benefit from a constructive earnings outlook, an uptick in domestic manufacturing, increased capital markets activity in 2026 and significant relative undervaluation. For our small-cap strategy specifically, heightened stock volatility has created an increasingly robust opportunity set while the current business and political environment appear to encourage a period of elevated consolidation activity in the small-cap universe. The Fund has been a beneficiary in recent periods, and we would certainly not be surprised to see the Fund continue to experience periodic takeovers of its holdings.
Please don’t hesitate to contact us with any questions or comments at clientservice@thirdave.com. Thank you for your continued confidence and trust.
Sincerely,
The Third Avenue Small-Cap Value Team
IMPORTANT INFORMATION
This publication does not constitute an offer or solicitation of any transaction in any securities. Any recommendation contained herein may not be suitable for all investors. Information contained in this publication has been obtained from sources we believe to be reliable, but cannot be guaranteed.
The information in this portfolio manager letter represents the opinions of the portfolio manager(s) and is not intended to be a forecast of future events, a guarantee of future results or investment advice. Views expressed are those of the portfolio manager(s) and may differ from those of other portfolio managers or of the firm as a whole. Also, please note that any discussion of the Fund’s holdings, the Fund’s performance, and the portfolio manager(s) views are as of June 30, 2026 (except as otherwise stated), and are subject to change without notice. Certain information contained in this letter constitutes “forward-looking statements,” which can be identified by the use of forward-looking terminology such as “may,” “will,” “should,” “expect,” “anticipate,” “project,” “estimate,” “intend,” “continue” or “believe,” or the negatives thereof (such as “may not,” “should not,” “are not expected to,” etc.) or other variations thereon or comparable terminology. Due to various risks and uncertainties, actual events or results or the actual performance of any fund may differ materially from those reflected or contemplated in any such forward-looking statement. Current performance results may be lower or higher than performance numbers quoted in certain letters to shareholders.
Date of first use of portfolio manager commentary: July 14, 2026
1 The MSCI USA Small Cap Value Index captures small cap securities exhibiting overall value style characteristics across the US equity markets. The value investment style characteristics for index construction are defined using three variables: book value to price, 12-month forward earnings to price and dividend yield. The index is not a security that can be purchased or sold.
2 The Russell 2000® Value Index measures the performance of US small cap value stocks. The index includes companies with relatively lower price-to-book ratios, lower 2-year I/B/E/S forecast growth and lower historical 5-year sales growth. The index is reconstituted fully in June to ensure accurate representation of the US small cap value style, with updates for parent index membership changes in December and quarterly IPO inclusions in March and September. The index is not a security that can be purchased or sold.
For the Third Avenue Glossary please visit here.
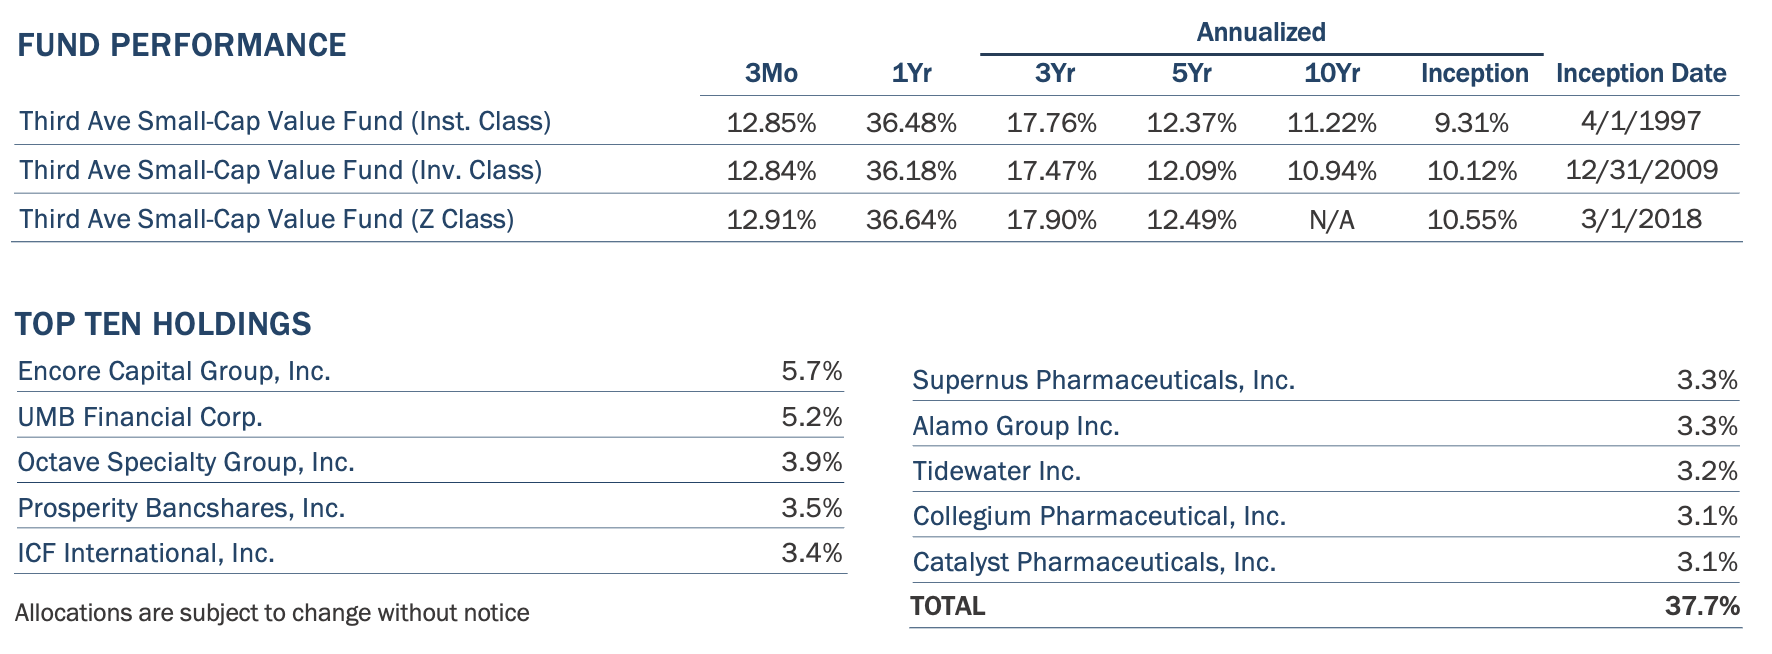
Past performance is no guarantee of future results; returns include reinvestment of all distributions. The above represents past performance and current performance may be lower or higher than performance quoted above. Investment return and principal value fluctuate so that an investor’s shares, when redeemed, may be worth more or less than the original cost. For the most recent month-end performance please visit the Fund’s website at www.thirdave.com. The gross expense ratio for the Fund’s Institutional, Investor and Z share classes is 1.26%, 1.51% and 1.20%, respectively, as of March 1, 2026.
Risks that could negatively impact returns include: fluctuations in currencies versus the US dollar, political/social/economic instability in foreign countries where the Fund invests, lack of diversification, volatility associated with investing in small-cap securities, and adverse general market conditions.
The fund's investment objectives, risks, charges, and expenses must be considered carefully before investing. The prospectus contains this and other important information about the investment company, and it may be obtained by calling 800-443-1021 or visiting www.thirdave.com. Read it carefully before investing.
Distributor of Third Avenue Funds: Foreside Fund Services, LLC.
Current performance results may be lower or higher than performance numbers quoted in certain letters to shareholders.
Third Avenue offers multiple investment solutions with unique exposures and return profiles. Our core strategies are currently available through '40Act mutual funds and customized accounts. If you would like further information, please contact a Relationship Manager at:


Notice
You are now leaving the Third Avenue Management website and being connected to a third-party website. Please note that Third Avenue Management is not responsible for the information, content or products(s) found on third-party websites.