


Notice
Notice
Value Fund Q126


Dear Fellow Shareholders,
For the three months ended March 31, 2026, the Third Avenue Value Fund (the “Fund”) returned 7.28%, as compared to the MSCI World Index (Net)1, which returned negative 3.57%, and the MSCI World Value Index (Net)2, which returned 1.18%. As of quarter-end, annualized Fund performance for the trailing three-year and five-year periods was 16.26% and 15.38%, respectively.
PERFORMANCE DISCUSSION
Performance during the quarter can be bifurcated into two distinct periods: the period leading up to the U.S. and Israeli military campaign in Iran, which began on February 28th, and the period afterwards. During the former 58-day period, the behavior of global equity markets could be described, in many ways, as an extension of 2025. Non-U.S. equities outperformed U.S. equities, value strategies performed relatively well, broadly speaking, and the U.S. dollar weakened relative to many foreign currencies. U.S. government bond yields also shrunk meaningfully during that period, partly in anticipation of a softening U.S. economy, but also in response to widely anticipated changes to the approach of the U.S. Federal Reserve Board of Governors upon the appointment of a new Chairman in May 2026. In this environment, as was the case during 2025, the Fund performed very well.
However, February 28th proved to be a sharp demarcation and the weeks that followed looked like a mirror image of the earlier period in some ways. During the latter period, equities in general had a far less positive experience, U.S. equities handily outperformed non-U.S. equities and the U.S. dollar strengthened meaningfully. U.S. government bond yields also increased sharply. The connective tissue between these capital market phenomena is the uniquely powerful global disruption to the transportation of oil and gas presented by the war in Iran. The cessation of energy flows through the Strait of Hormuz does legitimately threaten a significant global inflationary shock, which has, in turn, altered the outlook for interest rate movements in the U.S. and other countries and pushed the U.S. dollar upward. Undoubtedly there was also some influence of a capital flight to perceived safety at work following the onset of military action, manifesting in U.S. dollar appreciation and some global small-cap stock underperformance. Surging energy prices have understandably reanimated fears of global stagflation, impacting equity and credit markets broadly and disproportionately impacting equity markets within some countries that are largely reliant upon imported energy, especially in Asia.
To be clear, while the Fund performed more favorably in the former environment than the latter, it is not our approach to position the Fund for a particular macroeconomic or equity market scenario. Our approach is to build a portfolio of valuable businesses that are significantly undervalued, well-capitalized and which have, in our view, the capacity to build shareholder wealth at attractive rates over time. Our approach is decidedly value-oriented in nature and, although global and market cap-agnostic by mandate, our philosophical price-consciousness has led our team to invest a majority of the Fund’s assets outside of the United States and in smaller capitalization companies in recent years. Notwithstanding the Fund’s recent additions of two U.S.-listed companies discussed below, the Fund’s positioning today remains weighted towards smaller capitalization non-U.S. companies, and it would be disingenuous not to acknowledge the current positioning of the Fund and some likely performance sensitivity to those attributes.
During the quarter, all four of the Fund’s energy-related businesses ranked among the Fund’s five largest contributors to performance. Those holdings are Valaris, Tidewater, Harbour Energy, and Subsea 7, listed in order of the size of performance contribution. Details relating to these energy-related performance contributions, and the future implications of a potential energy crisis, are in some ways counterintuitive. We offer a discussion on this topic in paragraphs below.
Brazilian fuel distributor Ultrapar, Hong Kong holding company CK Hutchison and Japanese semiconductor capital equipment companies Horiba and JEOL also made important performance contributions. Auto company Subaru was the leading detractor from Fund performance and fellow auto producer BMW also made the list of top detractors. Copper miner Capstone Copper contributed negatively, as did U.K. companies Close Brothers and easyJet. Global cement companies Buzzi and Taiheiyo Cement also made the list of detractors. Fortunately, a somewhat lengthy list of detractors was more than offset by a healthy list of gainers, leading to meaningfully positive Fund performance for the quarter.
THE LITERAL FOG OF WAR
There is an uncomfortable parallel that can be drawn between the effective closure of the Strait of Hormuz and the experience of managing the Fund through the outbreak of COVID in the sense that we are currently navigating something unique within our lifetimes. We don’t believe it is an exaggeration to describe the virtual closure of the transportation system through which 20% of the world’s oil passes as historically unprecedented. An even larger percentage of the world’s liquified natural gas also passes through the Strait every day. An energy supply disruption of this scale, along with potentially significant damage to a wide range of processing assets, has had, or will have, significant impacts on many businesses further downstream, which in one way or another could come to entangle most of the world’s businesses.
Furthermore, as it relates to predicting the duration of the current disruption, there is little, if any, available information holding any real predictive value. At this point, we can only say that the length of the disruption - which will be determined by the duration of actual fighting, the extent of damage to energy infrastructure and transportation assets, and the time it will take to reestablish the perception of safety in the region – is what will determine the severity of economic impact. It is certainly not a contrarian view, but we are of the view that if the disruption is enduring, the quantity of energy flows currently being disrupted is far too large to be mitigated in any real way through available stop-gap measures. In short, if it lasts a while it will get complicated very quickly.
So how do we navigate the unprecedented? There are no silver bullets, only a handful of very important principles, which are the same principles that have been applied in managing the Fund for 35 years. First, our approach is to buy grey clouds and sell sunshine. We intentionally buy businesses facing headwinds, challenging near-term outlooks and investor pessimism because those are typically the necessary conditions which create the opportunity to underpay for a business. Underpaying is, in our view, a phenomenal way of protecting against the risk of permanent impairment of our collective capital. Conversely, paying high prices for high-performing businesses based upon the perception that smooth sailing and growth will continue long into the future exposes one to material risk of overpaying and creates vulnerability to unpleasant surprises, like a war in Iran.
Second, because we typically buy businesses facing challenging operating conditions at the time of purchase, it is an essential part of our approach to focus on companies that are well-financed. There are many ways in which having a lot of dry powder can offer opportunities for entrepreneurial management teams to create shareholder value, especially in environments marked by depressed valuations, but the concept we are highlighting here is that riding out protracted headwinds often requires financial durability. That consideration is intrinsic to our approach. As a result, the Fund typically holds a portfolio of companies that are not only inexpensive but are also very well-financed and financially prepared for protracted turbulence.
ENERGY INDUSTRY HOLDINGS – PERFORMANCE & OUTLOOK
“The seizure of “dark fleet” oil tankers shipping Venezuelan crude, the arrest of Nicolas Maduro, the U.S. claim of control over Venezuela’s energy industry and recent sanctions imposed directly upon some of Russia’s largest oil producing companies mark a profound divergence from U.S. sanctions activity in recent decades. It is impossible to know the full implications of these developments but, for the moment, gunboat diplomacy and military embargoes are back.”
Third Avenue Value Fund Q4 2025 Shareholder Letter
In the Fund’s Q4 2025 shareholder letter, we explained that the Fund’s energy industry exposure lies mostly within offshore energy services businesses, Tidewater, Valaris and Subsea 7. The Fund also holds one upstream oil and gas producer, Harbour Energy. We went on to explain that “During the quarter, and 2025 more broadly, the Fund’s oil and gas related businesses mostly did not perform well.” In writing these words, we did not necessarily anticipate that each of these investments would be among the largest contributors to Fund performance in the following quarter. Counterintuitively, almost all of the performance produced by Valaris and Tidewater occurred prior to the Feb 28th onset of military action in Iran. In both cases, resource conversion activity enabled by very well-capitalized balance sheets, played a large role. Our third offshore service business Subsea 7 is also going through the process of being acquired in an industry-consolidating transaction that was announced in July 2025.
During the quarter, Valaris became the subject of a takeover offer from a larger industry peer, Transocean. The premium price offered to Valaris shareholders stems from several factors, each central to our investment thesis; I) a building cyclical recovery of demand for offshore energy services, II) Valaris’ extremely difficult to replicate fleet of high quality floating drilling rigs and III) Valaris’ very well-capitalized balance sheet, which offers an indebted Transocean the opportunity to reduce its own financial leverage through an all-stock merger transaction with far better capitalized peer Valaris.
Separately, during the quarter, Tidewater agreed to purchase Wilson Sons Ultratug, an owner of 22 mostly Brazilian-built platform supply vessels operating in Brazil. The all-cash transaction will give Tidewater a much larger presence in Brazil, making it one of the largest operators in one of the world’s most attractive deepwater markets. This marks the third significant consolidating acquisition conducted by Tidewater during our ownership, each of which was enabled by an amount of financial flexibility and firepower that is unrivaled within the platform supply vessel industry.
As we evaluate the evolving prospects for our offshore energy services companies, we perceive recent military conflict to have both short-term and long-term implications. Middle East oil and gas are predominantly produced from onshore and shallow water wells. For that reason, the region is proportionately less reliant upon offshore service vessels and the offshore service vessels that are employed in the region are generally smaller and command far lower contract rates than larger, more powerful vessels operating in harsher, deepwater markets. Larger, more powerful, deepwater-capable assets comprise the core of Tidewater’s fleet. In the short term, the potential disruption to Tidewater’s business, to the extent exploration and production activity begins to decline in the Middle East, should be fairly limited. Similarly, Valaris’ drilling rig fleet also centers around very large, modern, deepwater assets generally operating in regions other than the Middle East. Still, Valaris also operates a fleet of less specialized, benign-environment jack-up rigs, a number of which are active in the Middle East. Valaris mostly operates its Middle East jack-up rigs through its joint venture with Saudi Arabian national oil company Aramco. While several of Valaris’ expiring Middle East jack-up contracts have very recently been extended, there is uncertainty about whether business as usual can continue given the current danger to people and property. On the other hand, in the longer term, both Tidewater and Valaris’ assets are mobile by design and are capable of being redeployed elsewhere.
“Donald Trump told allies hit by the closure of the Strait of Hormuz that “the US won’t be there to help you anymore” and to “go get your own oil.”
Financial Times – March 31, 2026
Furthermore, a strengthening cyclical recovery of offshore energy investment in other regions will be, we expect, one of the more lasting implications of the current fears of an energy crisis. That the current disruptions are occurring while memories of spiking energy prices in the early months of Russia’s invasion of Ukraine are still fresh only increases that likelihood. We have also repeatedly highlighted the significantly declining growth rate of oil and gas production from profoundly important U.S. onshore sources. Recent data points have not shaken us from this view. In our opinion, the broad mosaic of these developments suggests a heightened and lasting global focus on energy security, likely leading to an acceleration of deepwater energy activity in places like South America, West Africa and Europe. If that interpretation proves reasonably accurate, the longer-term outlook for Tidewater, Valaris and Subsea 7 should be further enhanced.
THE RESOURCE CONVERSION TRAIN ROLLS ON – CK HUTCHISON
Resource conversion activity also played a large part in powering the performance of CK Hutchison during the quarter. In our previous shareholder letter, we mentioned several major resource conversion transactions which appear to be underway at CK Hutchison, components of the company’s strategy to buy, build and dispose of businesses over long periods of time. One transaction discussed was the very high profile intended sale of one of the world’s largest portfolios of container terminals, including those at either end of the Panama Canal, which have offered CK Hutchison an unwanted role on the geopolitical stage.
However, we did not mention a potential disposition of any number of utility assets, such as U.K. Power Networks (“UKPN”), an electric utility serving 8.5 million homes and businesses in the Southeast and East of England. In February, European power company Engie SA agreed to purchase UKPN for an equity value of GBP 10.5 billion, as compared to an audited net asset value for UKPN of GBP 5.6 billion. CK Hutchison’s control of UKPN stems from indirect ownership through related companies, CK Infrastructure Holdings and Power Assets Holdings. In summing up the economic impact on CK Hutchison itself, the company expects to recognize a gain of HKD 14.5 billion (USD 1.9 billion) upon closing the sale, equivalent to roughly 6% of the company’s market capitalization.
As it relates to CK Hutchison’s running process to sell a portfolio of 43 global container terminals, there was a considerable amount of news during the quarter. In late February, on the back of a recent Panama Supreme Court ruling declaring CK Hutchison’s Panama Canal container terminal concessions unconstitutional, the Panamanian government raided and seized both container terminals and provisionally reassigned the concessions to other operators. CK Hutchison’s operation of the two terminals has enraged the current U.S. administration because it perceives CK Hutchison to be Chinese. Leaving aside our perception of the Panamanian justice system’s pliancy to U.S. will, there are a couple of interesting implications of the asset seizure. First, CK Hutchison has now filed a USD 2 billion international arbitration claim against the Panama government, which it may win. This theoretical amount equates to roughly 7% of CK Hutchison’s current market capitalization even though it stems from a compensation claim for only 2 of the 43 terminals CK Hutchison is attempting to sell and the entire container terminal business of CK Hutchison amounts to roughly 25% of its business value by our estimates. In other words, if they are successful in arbitration, the seizure and compensation process could prove to be a win from a business value perspective. Second, the two Panama terminals were, by leaps and bounds, the most politically contentious aspect of the container terminal portfolio sale. For that reason, the Panama terminals had been segregated from the larger pool of terminals to be sold. It is our suspicion that the seizure of the two Panama terminals may ease the path to execution for the sale of the remaining global portfolio of 41 terminals, which has the potential to create significant shareholder wealth for CK Hutchison’s shareholders as well as help highlight the extent of existing undervaluation of the company. All indications are that this transaction is still progressing.
QUARTERLY ACTIVITY
The Fund’s cash holdings began the quarter at 11.52% and rose somewhat early in the quarter as the Fund trimmed several high-performing positions and completed the disposition of Deutsche Bank. However, as the quarter continued, global equity market performance deteriorated. Several attractive opportunities were created in this environment, enabling the Fund to add to a handful of existing positions and initiate three new positions. At quarter end, the Fund’s cash position declined to 9.68%.
During the quarter ending March 31, 2026, the Fund initiated new positions in OSAKA Titanium Technologies Co., Ltd, Harley-Davidson, Inc. and Robert Half Inc.
OSAKA Titanium Technologies (“Osaka Titanium”) is a leading producer of titanium products, including titanium sponge and ingots, as well as high-performance materials, such as titanium powder used in additive manufacturing and silicon monoxide used in lithium-ion batteries. Titanium is identified as a critical mineral by the United States government, and titanium sponge production is a vital input in aerospace and defense applications, including aircraft engines and airframes.
Segments of the titanium industry have suffered an extended downcycle driven by elevated inventories, overcapacity, higher levels of recycling, increased availability of scrap and aggressive competition from Russia and China. The titanium sponge industry’s woes were further compounded by Boeing and Airbus-related supply chain disruptions, strikes, quality issues, airframe and engine problems and delayed FAA certifications. However, in immediate reaction to the Russian invasion of Ukraine, the aerospace industry’s response was to build-up channel inventories and buffer stocks, which led to a short-lived surge in sponge production capacity utilization that was followed by a subsequent drop in utilization as production levels at Boeing and Airbus remained constrained. The resulting hangover effect has left Osaka Titanium currently grappling with elevated working capital and lower than expected utilization rates and profitability, which in turn led to downward guidance revisions at the same time as the company progresses on a 25% capacity expansion. The Russian invasion of Ukraine, however, has caused Western aircraft supply chains to reconsider reliance on Russian-made titanium and to seek alternatives, which has resulted in improved forward-looking supply and demand dynamics for the handful of remaining producers capable of producing high grade titanium, the largest of which is Osaka Titanium.
The confluence of events has understandably weighed on Osaka Titanium’s share price, which allowed the Fund to initiate a position at a significant discount to estimated net asset value (NAV) and replacement cost. Despite near-term headwinds, Osaka Titanium remains a global leader in high-grade titanium sponge for aircraft applications with a unique opportunity to provide a solution to the Western aerospace supply chain as the company’s expansion project is completed by the first quarter of 2028 at the same time as the Western aerospace industry strives to reduce Russian dependency. Going forward, we believe the company has good prospects to grow shareholder value as working capital levels normalize, volumes and price realizations improve, margins expand, and as the company enters a planned, rapid deleveraging phase post completion of its expansion project. Importantly, improved profitability levels can already be observed in the aircraft supply chain downstream from Osaka Titanium, which one would expect to provide further support for an eventual rebound in profitability at the company.
Harley-Davidson manufactures motorcycles and accessories, sells financial services and earns brand licensing revenue. While its brand remains iconic, its core motorcycle market in the U.S., and the heavyweight bikes in which Harley-Davidson specializes, have suffered several years of sales declines. Some recent declines are attributable to the aftermath of the demand pull-forward that occurred during COVID, though demand for new heavyweight bikes has been stagnant-to-declining for years. For Harley-Davidson specifically, the last several years have also been marked by multiple activist campaigns, board turnover, management changes and a string of strategic missteps.
One central strategic misstep, which represented a priority for previous management, included a virtual exit from lower priced entry-level bikes in favor of more expensive and higher profit margin bikes. While conceptually appealing, that strategy ignored the need to attract new entry-level customers and that entry-level bike purchases also lead to incremental demand for high margin customizations, branded accessories and financial service contract originations. Possibly most important, however, was a lack of recognition that stuffing dealerships with far more big expensive bikes than are in demand is bad for dealer economics, creates dealer frustration and discontent and ultimately results in significant price discounting to clear stale excess inventory. Our sense is that elements of the strategy changes being implemented by new management create the opportunity for far better operating performance from the core motorcycle business and it is evident that significant progress has already been made in clearing older inventory from dealership floors.
It is also notable that, despite manufacturing 100% of its bikes destined for the U.S. market in its Wisconsin and Pennsylvania plants, tariff expenses have created a major financial headwind for Harley-Davidson. While we can’t say when this situation may improve, a very substantial tariff expense is yet one more headwind facing Harley-Davidson today, which may not prove to be permanent.
Further, Harley-Davidson’s electric motorcycle venture, LiveWire, has been a significant drag on Harley-Davidson since its birth and electric motorcycle sales have fallen stunningly short of expectations. As recently as 2022, LiveWire had projected it would sell more than 50,000 electric motorcycles in 2025 but ultimately achieved only about 1% of that volume target. Because Harley-Davidson owns nearly 90% of publicly traded LiveWire, its significant operating losses remain consolidated within Harley-Davidson’s financial statements, creating a very significant optical drag on Harley-Davidson’s operating performance. Harley-Davidson has been providing ongoing support to sustain the business, though management has indicated that LiveWire has received its final financial lifeline from the company. A solution that disentangles the consolidation of the two companies, such as the eventual insolvency of LiveWire, would remove the optical drag on Harley-Davidson’s operating profits and the distractions of a failing non-core business. We view an eventual LiveWire insolvency as highly probable.
On a more positive note, last year, Harley-Davidson Financial Services (HDFS), the company’s financial services subsidiary, was able to release a very substantial amount of capital through a creative transaction in which it sold a substantial portion of its existing financial receivables and created a future flow agreement for most of its retail motorcycle loans to partners KKR and PIMCO. Harley-Davidson also sold a 4.9% equity stake in HDFS to each partner. HDFS will retain roughly one-third of new retail loan originations going forward and earn ongoing loan servicing fees from its partners. The proceeds from the transaction enable Harley-Davidson to further invest in manufacturing operations and continue returning capital to shareholders. The new structure of HDFS will operate with less capital intensity, more fee generation and higher returns on capital. The transaction also highlights the underlying value of HDFS, which has historically been underappreciated by the market.
Harley-Davidson plans to detail its operational improvement strategy later this spring. While there’s urgency to finally put the company back on the right path, Harley-Davidson is afforded flexibility from a sizeable net cash position in its industrial operations. Market expectations remain very low, with the company’s shares trading at a sizeable discount to tangible book value and a modest multiple of very depressed earnings.
Robert Half is a professional staffing company specializing in temporary placements in the fields of finance and accounting, technology, and administrative and customer support. Robert Half also operates Protiviti, which provides consulting in a variety of fields including risk management and internal audit. The U.S. staffing industry has experienced three consecutive years of muted activity following a period of unusually strong labor demand after the pandemic, when U.S. unemployment fell to multi-decade lows. As companies have been digesting excessive prior hiring of permanent employees, the use of temporary labor has suffered a significant cyclical downturn, leaving temporary workers at a historically low share of the overall workforce.
Beyond cyclical pressures, current investor concerns center on the potential for artificial intelligence to reduce demand for certain roles and automate aspects of the recruiting process. An alternative view holds that disciplines such as tax and audit require considerable professional judgment and risk assessment that extend beyond historical data and rules-based implementation, sustaining the need for human expertise. Further, proprietary information relating to individual temp employee performance in various roles, which has been accumulated by the likes of Robert Half over decades, may prove to be a valuable asset to employers in a world in which AI renders it difficult to discern fact from fiction. Additionally, although barriers to entry in staffing may seem low, Robert Half benefits from an extensive two-sided professional network, long-running proprietary candidate data and expertise in matching specific skill sets to defined client needs.
Furthermore, Federal Reserve Bank of St. Louis data through March 2026 refute the notion that artificial intelligence has been playing a role in declining temporary staffing. There is also little evidence within those data series to suggest that professional services will be pervasively impacted. Meanwhile the broader U.S. temporary workforce has recently begun to show signs of stability near 2.5 million workers.
Robert Half is extremely well-financed with a debt-free balance sheet and a substantial cash balance. The nature of the company’s business requires very little capital-intensity, and the company continues to produce a material amount of free cash flow, even in deeply depressed operating conditions. Management continues to strategically retain experienced recruiters despite near-term earnings pressure, recognizing that new recruiters require approximately two years to reach average productivity, and that the ability to retain recruiting staff in a cyclically depressed environment represents a strategic competitive advantage. There are also signs that Robert Half and a few industry peers have made increased efforts to hire additional recruiters in anticipation of an eventual cyclical upturn.
The company’s shares trade at a low single-digit multiple of normalized cash flow. The company has generated positive annual free cash flow for more than three consecutive decades and has consistently returned much of that cash to shareholders through dividends and share repurchases. The company’s dividend, which, at the present share price, offers a near-double-digit yield, is currently supported by ongoing cash generation.
Thank you for your confidence and trust. We look forward to writing again next quarter. In the interim, please do not hesitate to contact us with questions or comments at clientservice@thirdave.com.
Sincerely,
Matthew Fine

IMPORTANT INFORMATION
This publication does not constitute an offer or solicitation of any transaction in any securities. Any recommendation contained herein may not be suitable for all investors. Information contained in this publication has been obtained from sources we believe to be reliable, but cannot be guaranteed.
The information in this portfolio manager letter represents the opinions of the portfolio manager(s) and is not intended to be a forecast of future events, a guarantee of future results or investment advice. Views expressed are those of the portfolio manager(s) and may differ from those of other portfolio managers or of the firm as a whole. Also, please note that any discussion of the Fund’s holdings, the Fund’s performance, and the portfolio manager(s) views are as of March 31, 2026 (except as otherwise stated), and are subject to change without notice. Certain information contained in this letter constitutes “forward-looking statements,” which can be identified by the use of forward-looking terminology such as “may,” “will,” “should,” “expect,” “anticipate,” “project,” “estimate,” “intend,” “continue” or “believe,” or the negatives thereof (such as “may not,” “should not,” “are not expected to,” etc.) or other variations thereon or comparable terminology. Due to various risks and uncertainties, actual events or results or the actual performance of any fund may differ materially from those reflected or contemplated in any such forward-looking statement. Current performance results may be lower or higher than performance numbers quoted in certain letters to shareholders.
Date of first use of portfolio manager commentary: April 15, 2026
1 The MSCI World Index captures large and mid-cap representation across 23 Developed Markets (DM) countries. With 1,320 constituents, the index covers approximately 85% of the free float-adjusted market capitalization in each country. Results for the index are inclusive of dividends and net of foreign withholding taxes.
2 The MSCI World Value Index captures large and mid cap securities exhibiting overall value style characteristics across 23 Developed Markets (DM) countries. The value investment style characteristics for index construction are defined using three variables: book value to price, 12-month forward earnings to price and dividend yield. Results for the index are inclusive of dividends and net of foreign withholding taxes.
For the Third Avenue Glossary please visit here.
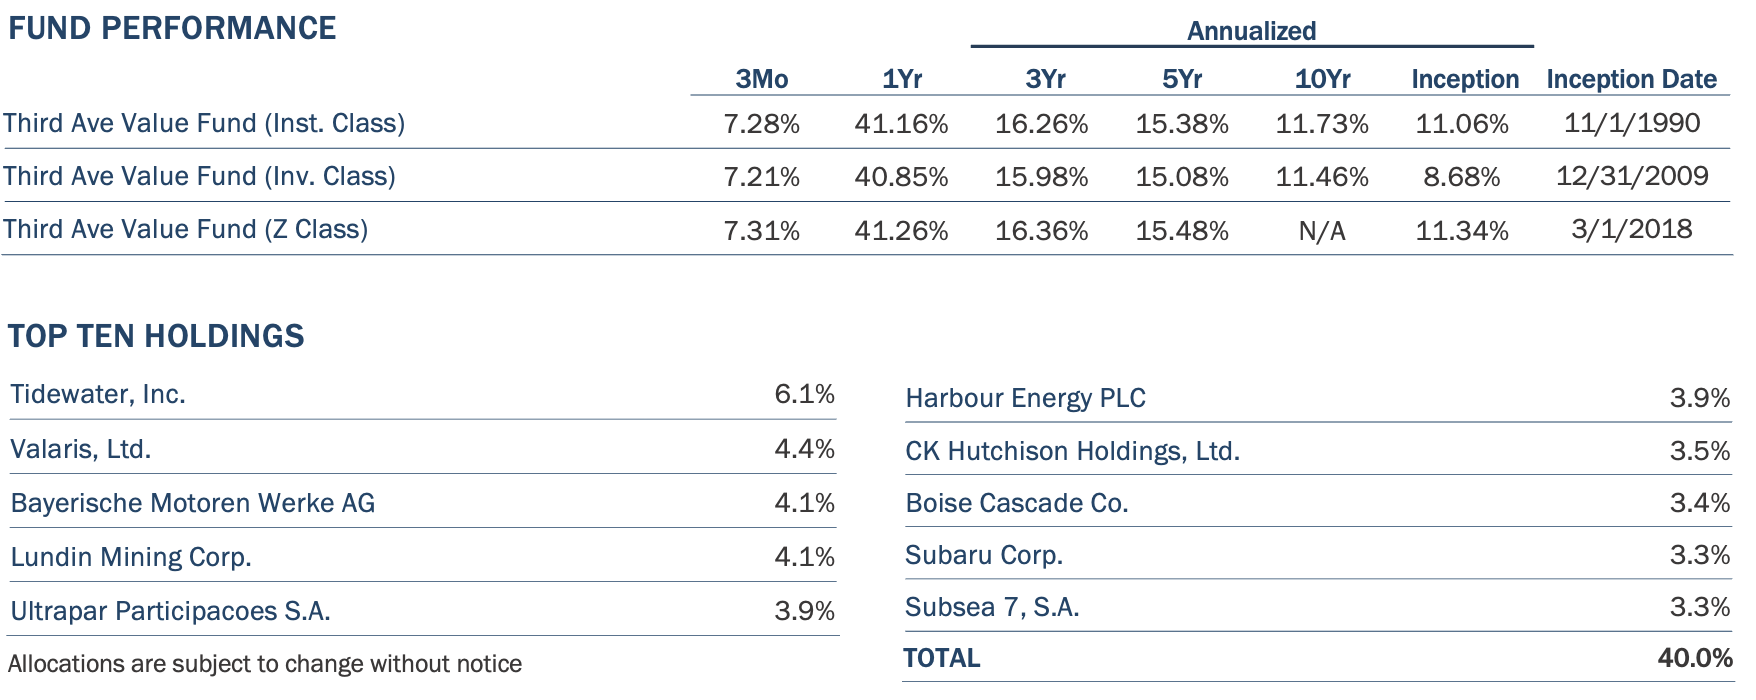
Past performance is no guarantee of future results; returns include reinvestment of all distributions. The above represents past performance and current performance may be lower or higher than performance quoted above. Investment return and principal value fluctuate so that an investor’s shares, when redeemed, may be worth more or less than the original cost. For the most recent month-end performance, please visit the Fund’s website at www.thirdave.com. The gross expense ratio for the Fund’s Institutional, Investor and Z share classes is 1.16%, 1.39% and 1.09% , respectively, as of March 1, 2026.
Risks that could negatively impact returns include: fluctuations in currencies versus the US dollar, political/social/economic instability in foreign countries where the Fund invests lack of diversification, and adverse general market conditions.
The fund's investment objectives, risks, charges, and expenses must be considered carefully before investing. The prospectus contains this and other important information about the investment company, and it may be obtained by calling 800-443-1021 or visiting www.thirdave.com. Read it carefully before investing.
Distributor of Third Avenue Funds: Foreside Fund Services, LLC.
Current performance results may be lower or higher than performance numbers quoted in certain letters to shareholders.
Third Avenue offers multiple investment solutions with unique exposures and return profiles. Our core strategies are currently available through '40Act mutual funds and customized accounts. If you would like further information, please contact a Relationship Manager at:

